Scalping Strategy (5min)
A scalping indicator using RSI crossovers and moving averages to generate trading signals. Combines multiple technical analysis tools to identify potential trend reversals and momentum shifts.
Explore 11,183 indicators. Filter beyond the obvious.
Discover the tools that fit the way you trade.
11,183 tools to explore
A scalping indicator using RSI crossovers and moving averages to generate trading signals. Combines multiple technical analysis tools to identify potential trend reversals and momentum shifts.
A dynamic scalping indicator that identifies significant price zones and candle movements to help traders make precise entry and exit decisions in fast-moving markets.
A multi-timeframe trading signal strategy using daily high-low points, moving averages, and MACD to identify potential price reversals and trend changes across different market conditions.
A trading indicator that plots vertical and horizontal opening lines on an hourly chart with customizable opening time intervals for precise market entry and exit points.
A mathematical strategy identifying market reversals using predefined price levels and multi-candle confirmation patterns for precise intraday trading entry and exit points.
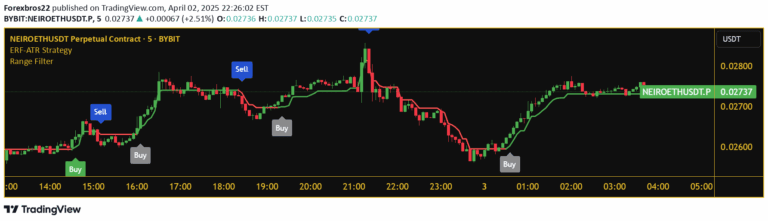
A systematic trading strategy that uses range filters, RSI, ADX, and ATR to identify high-probability trend trades while filtering out market noise and managing risk dynamically.
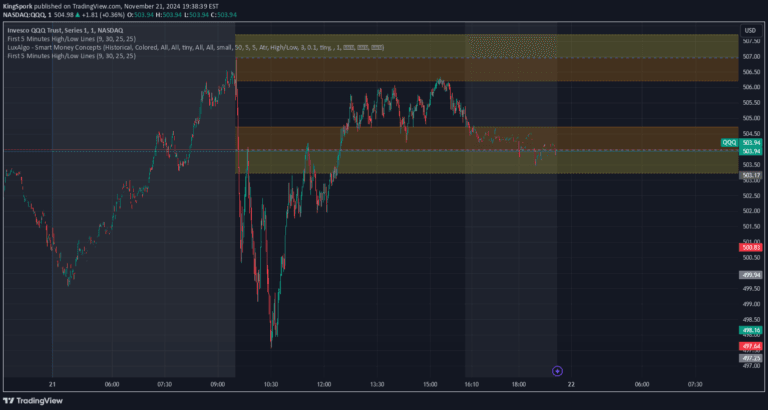
A trading indicator that marks the high and low of the first 5-minute candle, creating zones to help traders identify potential entry and exit points based on initial session momentum.
A day trading strategy focusing on break and retest of market open 5-minute high and low lines on 1-minute charts, using specific entry confirmation techniques.
A specialized statistical indicator tracking the precise timing of market highs and lows during opening and closing hours on 5-minute charts for US indices.
A trading signal using Bollinger Bands and 200-period exponential moving average to identify market trends, particularly effective for crypto assets on 5-minute timeframes.
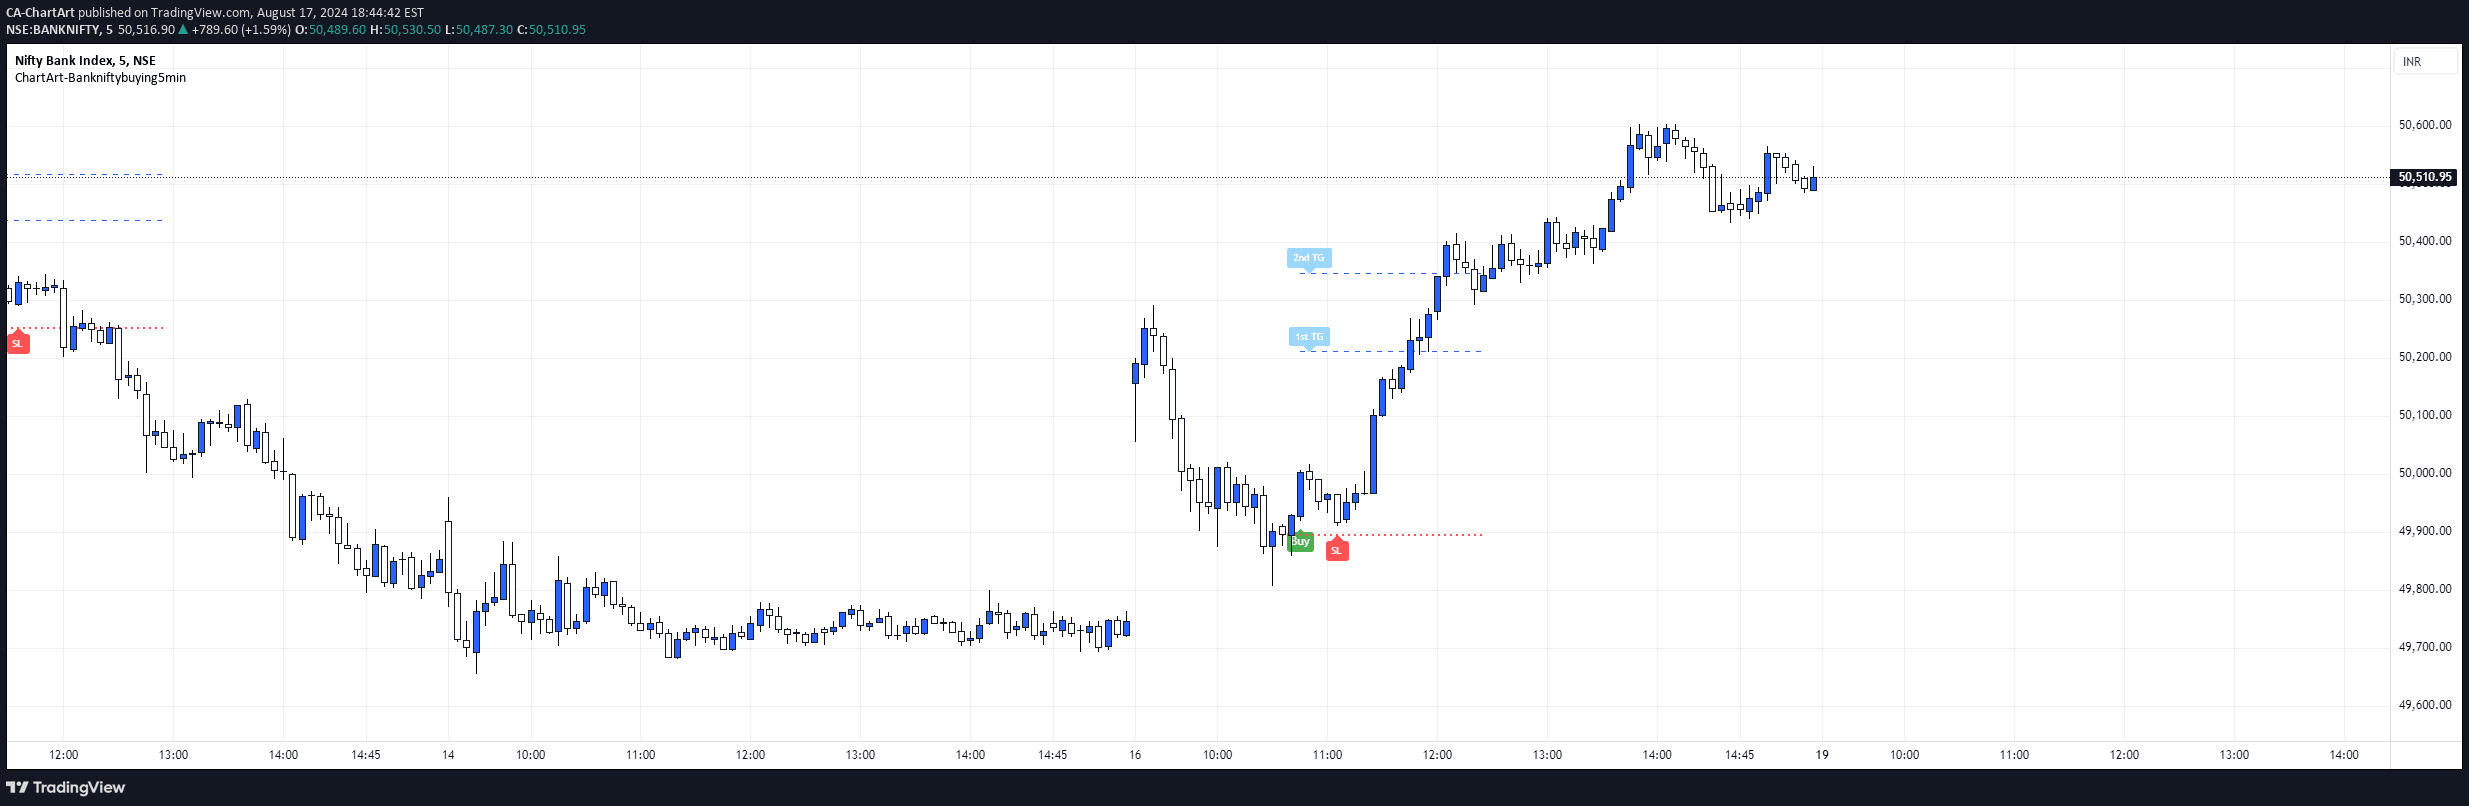
A precise intraday trading strategy for BankNifty using moving averages, RSI, and candlestick patterns to identify potential reversals during minor downtrends with structured entry and exit rules.
A comprehensive intraday trading indicator combining Opening Range Breakout, Adaptive EMAs, and Previous Day High/Low levels to identify market trends and potential trade opportunities.
Likes, views, and comments are historical TradingView snapshots. They describe attention, not trading performance.