A trading signal using Bollinger Bands and 200-period exponential moving average to identify market trends, particularly effective for crypto assets on 5-minute timeframes.
Explore complementary indicator rolesHow it works
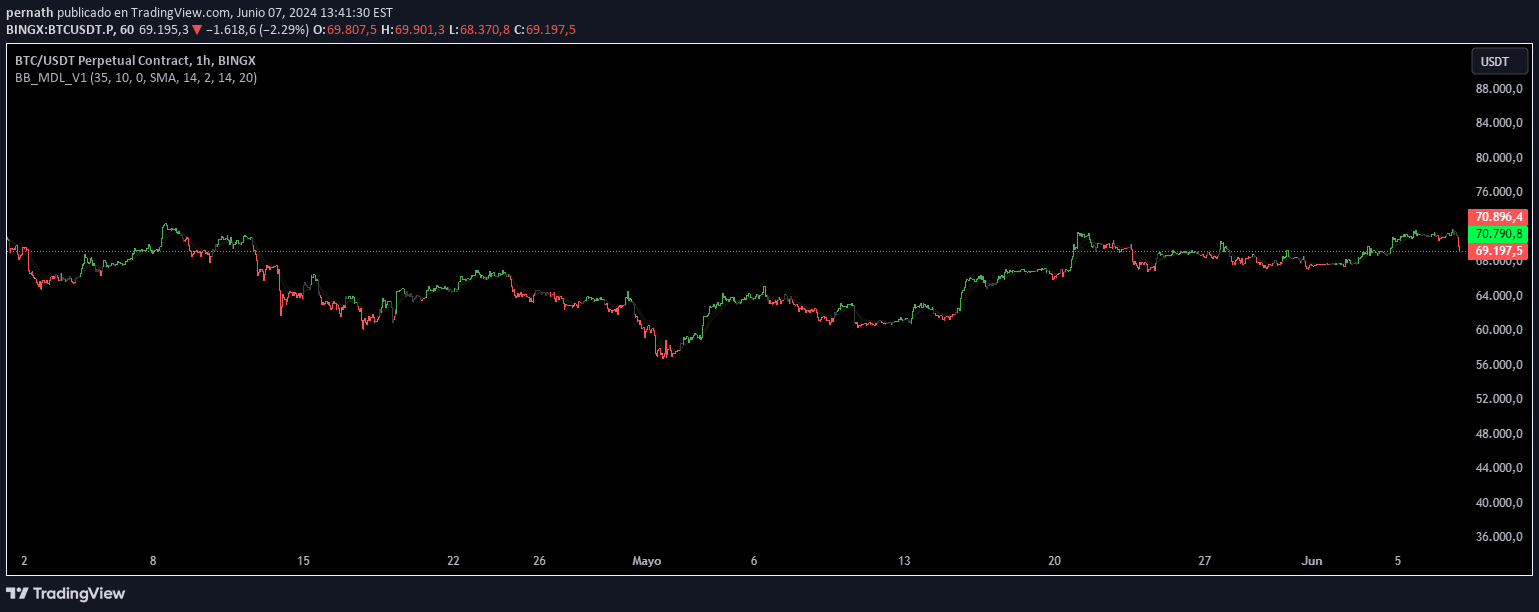
The indicator combines two key technical analysis tools: Bollinger Bands and a 200-period exponential moving average to analyze market trends. The Bollinger Bands are set with a customizable length, currently defaulting to 35 periods, which creates a dynamic price channel around the average price movement. The exponential moving average provides a smoothed trend line that helps identify the overall market direction.
By observing the interaction between the Bollinger Bands' middle line and the 200-period exponential moving average, traders can detect potential trend changes and market momentum. The customizable nature of the Bollinger Bands length allows traders to adapt the indicator to different market conditions and asset characteristics.
Why it may be useful
This trading signal is valuable because it offers a comprehensive view of market trends and potential price movements using multiple technical indicators. By combining Bollinger Bands and the exponential moving average, traders can gain insights into market volatility, trend strength, and potential entry or exit points. The flexibility of adjusting the Bollinger Bands length makes it adaptable to various trading styles and market conditions.
The indicator helps traders make more informed decisions by providing a visual representation of price dynamics and potential trend reversals. Its simplicity and effectiveness make it an excellent tool for both novice and experienced traders seeking to understand market behavior and identify potential trading opportunities.
When to explore it
This trading signal is most effective when used on shorter timeframes, particularly 5-minute charts for cryptocurrencies like SOL, FTM, and MASK. It works best in markets with clear trending characteristics and moderate volatility, where price movements are not extremely erratic. Traders should consider using this indicator in conjunction with other technical analysis tools to confirm signals and reduce false positives.
The strategy is particularly useful for traders looking to identify short-term trend changes and potential entry or exit points. It can be especially powerful when combined with other complementary indicators, providing a more comprehensive view of market dynamics and increasing the probability of successful trades.
Keep exploring
What we’ve verified
Access, alerts and repainting behaviour have not been independently verified for this indicator. Check the creator’s current publication and settings.
General descriptions and classifications are recovered research. Verified details above identify the specific checks we have completed. Check the creator’s current publication for later changes.