Auto Fibonacci Retracement // Atilla Yurtseven
A Pine Script tool for automatically plotting Fibonacci retracement levels, enabling traders to identify potential support and resistance areas within a customizable date range.
Explore 11,183 indicators. Filter beyond the obvious.
Discover the tools that fit the way you trade.
11,183 tools to explore
A Pine Script tool for automatically plotting Fibonacci retracement levels, enabling traders to identify potential support and resistance areas within a customizable date range.
A comprehensive market health indicator tracking multiple metrics including advancing/declining stocks, volume trends, and price movement across different market indices.
A dynamic Fibonacci extension tool that automatically calculates and plots support and resistance levels on a chart, helping traders identify potential price targets and reversal zones.
Breakaway Momentum measures NYSE stock advances versus declines over ten days. When advances exceed 1.97 times declines, it signals a significant market movement.
A dual-market NYSE & NASDAQ Advance-Decline Oscillator that tracks market breadth by measuring the difference between advancing and declining stocks across two major exchanges.
A comprehensive market internals indicator that provides insights into market breadth, volume dynamics, volatility, and trading range using multiple technical metrics.
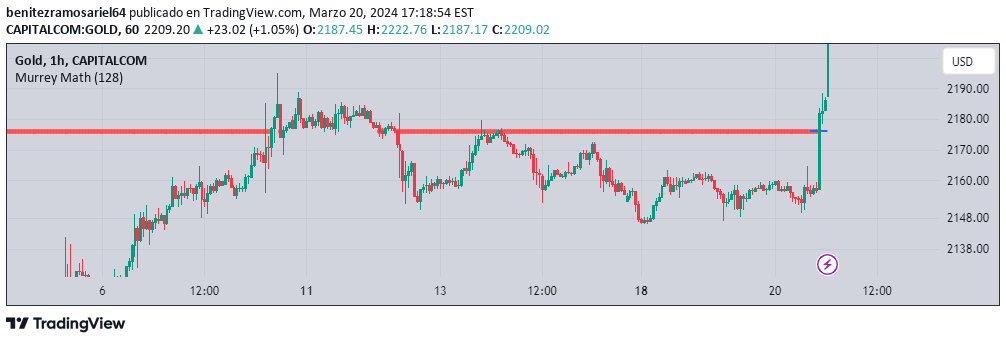
Murrey Math is a technical analysis tool that calculates specific horizontal price levels, helping traders identify potential support, resistance, and price rotation points.
A gap analysis indicator that transforms price gaps into trend-like lines, helping traders identify key support and resistance levels and potential market direction.
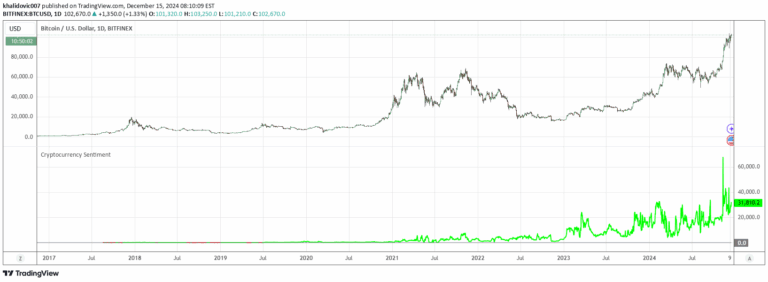
A cryptocurrency sentiment indicator that calculates the difference between long and short positions to reveal market bias and potential trend direction on Bitfinex.
An advanced RSI indicator offering multi-level buy and sell signals with customizable thresholds, providing traders with precise entry and exit points across different market conditions.
A market breadth indicator tracking the advance/decline ratio of top 20 Nifty stocks to assess overall market strength and sentiment.
Likes, views, and comments are historical TradingView snapshots. They describe attention, not trading performance.