How To Import And Offset CSV Data
A script demonstrating CSV data import, offset, and plotting using arrays. Provides a basic framework for data manipulation and visualization in trading analysis.
Explore 11,183 indicators. Filter beyond the obvious.
Discover the tools that fit the way you trade.
11,183 tools to explore
A script demonstrating CSV data import, offset, and plotting using arrays. Provides a basic framework for data manipulation and visualization in trading analysis.
A portfolio tracking tool that calculates live P&L for up to 40 financial instruments using simple CSV input, providing real-time performance metrics across different asset classes.
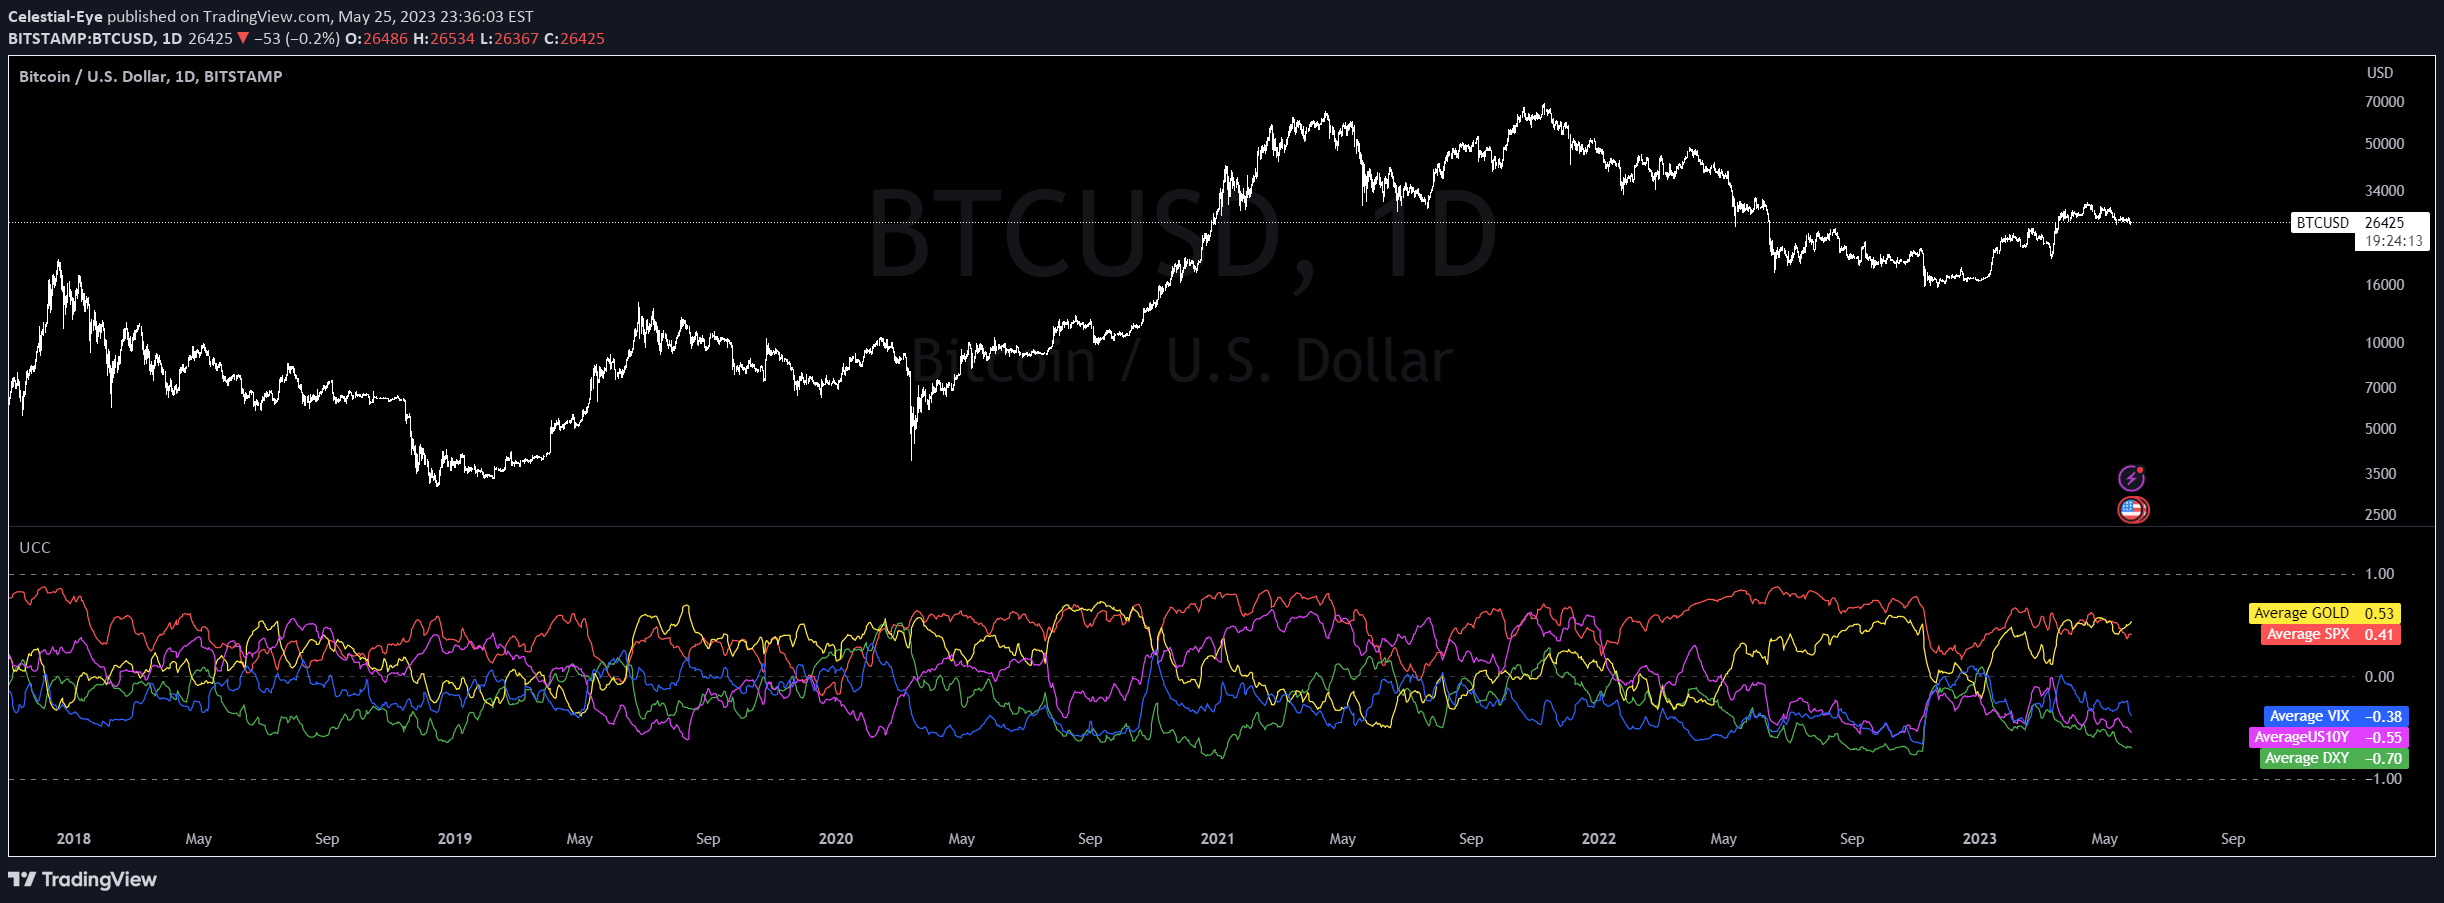
A correlation analysis signal examining relationships between major market indicators like SPX, DXY, Gold, US10Y, and VIX to provide comprehensive market insights.
A flexible trading script for analyzing multiple stock ticker symbols simultaneously, calculating their rate of change and visualizing the results across different market conditions.
A flexible multi-timeframe moving average indicator that allows traders to display up to 24 moving averages across 5 timeframes with customizable settings and preset configurations.
A script demonstrating how to import and manipulate CSV data in TradingView, providing a method for data input and analysis with specific character limitations.
A Pine Script tool for exporting comprehensive candlestick data from TradingView charts, providing real-time OHLC and volume information with easy CSV export capabilities.
A trading script that tracks and stores all cryptocurrency trades, calculates average prices, and provides comprehensive trading statistics beyond exchange limitations.
The S&P 500 Estimated PE Ratio indicator provides insights into market valuation by tracking forward-looking price-to-earnings ratios from historical data since 2008.
Likes, views, and comments are historical TradingView snapshots. They describe attention, not trading performance.