
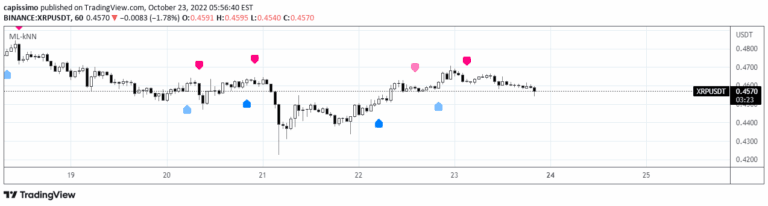
Machine Learning: kNN-based Strategy
A k-Nearest Neighbours machine learning strategy that predicts market moves by analyzing historic data and finding similar past market conditions to forecast future price directions.
Explore 11,183 indicators. Filter beyond the obvious.
Discover the tools that fit the way you trade.
11,183 tools to explore
A k-Nearest Neighbours machine learning strategy that predicts market moves by analyzing historic data and finding similar past market conditions to forecast future price directions.
An advanced Fibonacci Retracement tool that automatically draws levels on various technical indicators, helping traders identify potential support and resistance zones.
A trading indicator that combines CCI/Momentum and RSI to identify potential market reversals by detecting extreme price points and momentum shifts.
A dynamic trend-following oscillator based on CCI that tracks market trends, identifies potential reversals, and provides visual trend confirmation through adaptive trailing stops and color-coded alerts.
A versatile supertrend indicator that generates signals across multiple technical indicators like RSI, MFI, and volume metrics. Offers customizable range filtering and overbought/oversold configuration.
A powerful trend identification indicator combining Commodity Channel Index and Average True Range to detect market trends with dynamic support and resistance levels.
A multi-indicator trading strategy combining RSI, CCI, and Stochastic Oscillator to generate customizable buy and sell signals with clear visual indicators.
An advanced trading signal that combines RSI, divergence, and momentum oscillators to generate precise buy and sell entries with adaptive mean reversion and trend filtering mechanisms.
The Reversion Zone Index combines CCI, Choppiness Index, and Bollinger Bands Percentage to identify mean reversion signals through a comprehensive market analysis approach.
A comprehensive trading signal combining six technical indicators including RSI, MACD, Stochastic, Loxxer, CCI, and Velocity to generate trading insights and potential market entry points.
A technical analysis tool using Commodity Channel Index to identify trend reversals and market momentum through an oscillator with smoothing and support/resistance zones.
A multi-indicator signal that identifies potential market reversal zones by combining Bollinger Bands Percentile, Choppiness Index, and Commodity Channel Index to assess price movements.
Likes, views, and comments are historical TradingView snapshots. They describe attention, not trading performance.