
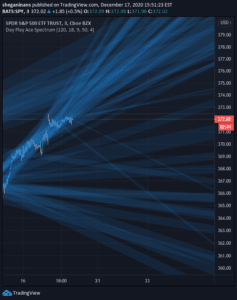
Daily Play Ace Spectrum
Daily Play Ace Spectrum is an advanced, configurable trading indicator extending the original Ace Spectrum with more parameters for enhanced sensitivity and adaptability across shorter timeframes.
Explore 11,183 indicators. Filter beyond the obvious.
Discover the tools that fit the way you trade.
11,183 tools to explore
Daily Play Ace Spectrum is an advanced, configurable trading indicator extending the original Ace Spectrum with more parameters for enhanced sensitivity and adaptability across shorter timeframes.
MATHR3E RAMP-MA is a trend-following indicator that helps traders identify market direction and potential entry points using moving average crossovers and rate of change analysis.
A volume surge analysis indicator that detects significant market activity by measuring volume relative to its moving average and analyzing price movement direction and momentum.
A volume-weighted average price (VWAP) oscillator that normalizes market data, providing insights into price trends, momentum, and potential market reversals.
ADM Indicator identifies market phases by tracking price movements across accumulation, manipulation, and distribution stages, providing traders strategic insights into potential trend changes.
A unique trading indicator combining Heikin Ashi candles with pivot points, offering dynamic support and resistance levels across multiple timeframes for Bitcoin analysis.
A multi-dimensional trading indicator combining Directional Movement Index, Average Directional Index, and volume analysis to identify market momentum, trend strength, and potential reversals.
The Directional Movement Index (DMI) and Average Directional Index (ADX) help traders assess trend strength and direction by analyzing price movements and directional indicators.
A comprehensive trend strength indicator using Average Directional Index (ADX) and Directional Indicators (+DI/-DI) to assess market momentum and potential trend reversals.
A comprehensive pivot point indicator that calculates high and low levels across multiple timeframes using various pivot point calculation methods, enabling traders to identify key support and resistance levels.
A 4-hour trading indicator that calculates support, resistance, and pivot levels to help traders identify market trends and potential entry/exit points during the USA trading session.
DMI-Luminate is an advanced Directional Movement Index indicator that analyzes trend strength, direction, and equilibrium points through enhanced directional movement calculations.
Likes, views, and comments are historical TradingView snapshots. They describe attention, not trading performance.