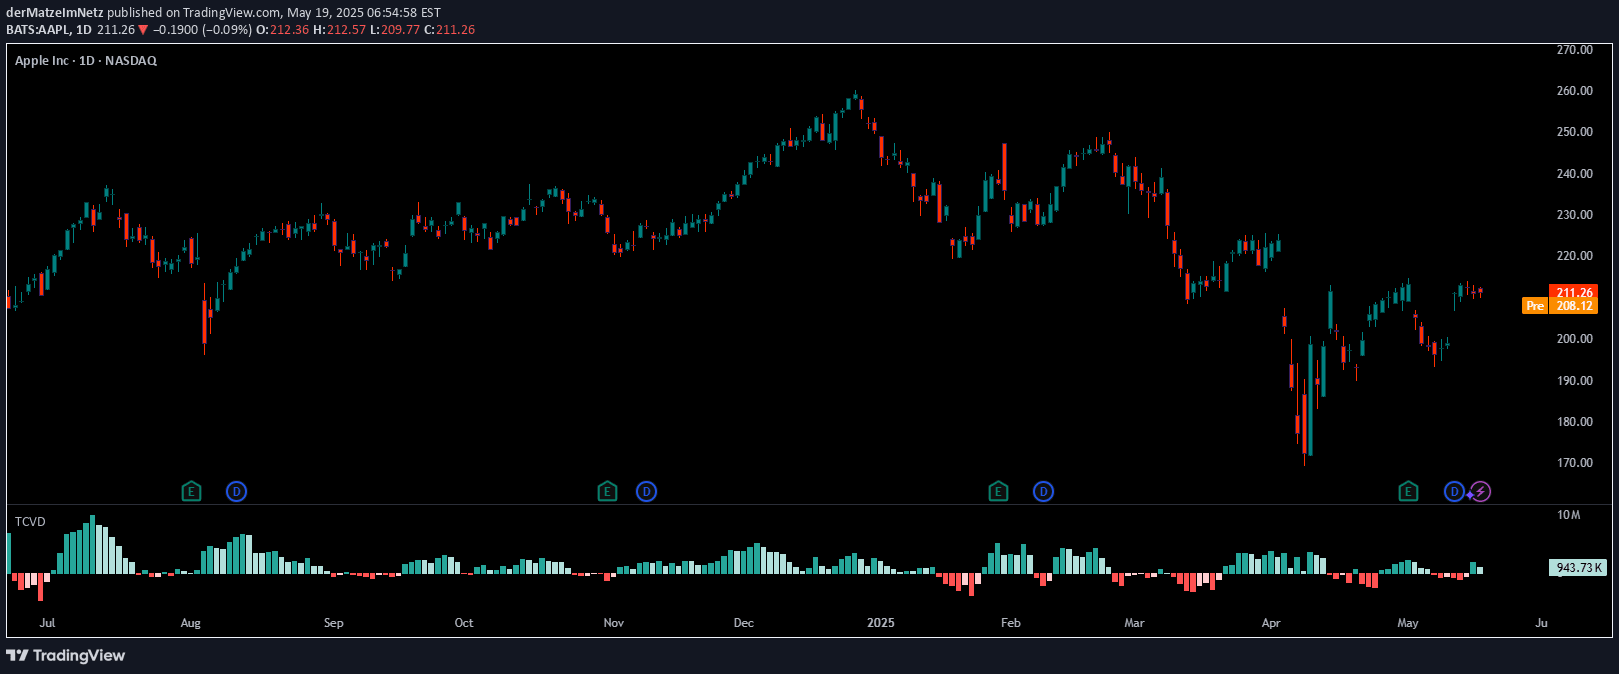
A multi-dimensional trading indicator combining Directional Movement Index, Average Directional Index, and volume analysis to identify market momentum, trend strength, and potential reversals.
Explore complementary indicator rolesHow it works
The indicator integrates the Directional Movement Index (DMI) with Average Directional Index (ADX) and volume analysis to create a comprehensive market analysis tool. It calculates the DMI Delta by comparing DI+ and DI- values, displaying this as a histogram that visualizes changes in directional bias and momentum.
The system uses a color-coded approach to highlight market conditions, with the ADX filtering trends by measuring overall move strength. Volume analysis is incorporated using a customizable multiplier to reveal significant market participation, adding depth to the directional insights and helping traders distinguish between regular and powerful market movements.
Why it may be useful
This indicator provides traders with a multi-layered approach to market analysis, going beyond traditional single-metric tools by combining momentum, trend strength, and volume insights. It helps traders understand not just price movement, but the underlying market dynamics that drive those movements, offering a more nuanced view of potential trading opportunities.
By integrating different analytical components, the indicator allows traders to detect early signs of trend reversals, identify divergence between price action and momentum, and assess the reliability of potential trading signals. This comprehensive approach reduces the likelihood of false signals and provides traders with a more robust decision-making framework.
When to explore it
The indicator is most effective in markets with clear directional movements and significant volume fluctuations. It works particularly well for traders looking to identify potential trend reversals, confirm existing trends, or detect moments of market sentiment shift. The tool is especially valuable during periods of market transition or when seeking to understand the underlying strength of a price movement.
Traders should optimize the indicator's settings through backtesting, adjusting parameters like the ADX threshold and volume multiplier to match specific market conditions and trading styles. It is particularly useful for traders who want a comprehensive view of market dynamics across different timeframes, from scalping to swing trading.
Keep exploring
What we’ve verified
Access, alerts and repainting behaviour have not been independently verified for this indicator. Check the creator’s current publication and settings.
General descriptions and classifications are recovered research. Verified details above identify the specific checks we have completed. Check the creator’s current publication for later changes.