YOUR INDICATOR RESEARCH STARTS HERE

Find the right indicator.
Understand what it does.

Explore 11,183 indicators. Filter beyond the obvious.
Discover the tools that fit the way you trade.

THE INDICATOR LIBRARY

Results for “DMA”

11,183 tools to explore

49 indicators matching your filters
Save search
MomentumOscillatorTrend

MACD & RSI Overlay (Expo)

by Zeiierman

A technical analysis tool combining MACD and RSI overlaid on price charts, offering traders insights into market momentum, trend direction, and potential trade signals.

Main price chart · unverifiedScalping · Day Trading
Explore
3.2Klikes92Kviews28comments
Save
VolumeEditor’s pick

Range Volume Change

by dman103

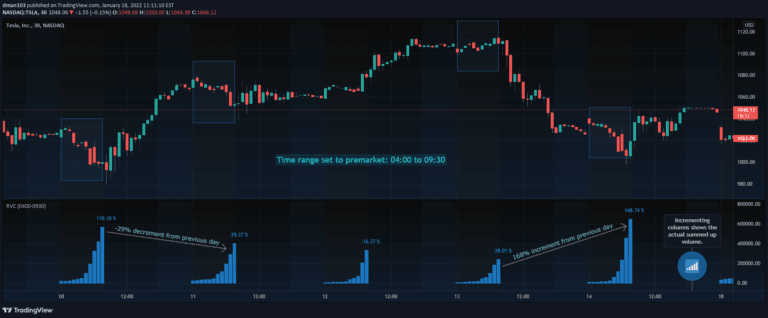
Range Volume Change (RVC) is a custom trading indicator that tracks volume percentage changes within a specific time range, helping traders understand volume dynamics across different trading periods.

Separate pane · unverifiedDay Trading · Swing Trading
Explore
2.2Klikes92.6Kviews38comments
Save
LevelsSignalVolatility

Range Detection

by HasanRifat

A trading indicator designed to identify sideways or ranging markets by tracking significant price candles and establishing dynamic range boundaries based on price movement.

Main price chart · unverifiedDay Trading · Swing Trading
Explore
1.5Klikes26.3Kviews9comments
Save
TrendSignalLevels

Trend Magic Enhanced [AlgoAlpha]

by AlgoAlpha

A powerful trend identification indicator combining Commodity Channel Index and Average True Range to detect market trends with dynamic support and resistance levels.

Main price chart · unverifiedScalping · Day Trading
Explore
1.5Klikes23.1Kviews3comments
Save
TrendSignalLevels

Zigzag Tails [Trendoscope®]

by Trendoscope

A dynamic indicator that calculates anchored VWAPs and average prices using Zigzag pivot points, offering advanced market movement insights with customizable tail configurations.

Main price chart · unverifiedScalping · Day Trading
Explore
606likes18.2Kviews14comments
Save
SignalLevelsPatterns

Engulfing Candles with Sweep by Aydmaxx

by AydMax

A trading signal that identifies bullish and bearish engulfing candlestick patterns with liquidity sweeps, helping traders spot potential market reversals and entry points.

Main price chart · unverifiedScalping · Day Trading
Explore
307likes5.6Kviews6comments
Save

Likes, views, and comments are historical TradingView snapshots. They describe attention, not trading performance.

START WITH A QUESTION

A little less searching.
A lot more understanding.

Tell DeepAlpha what you need. Get an explanation, a shortlist,
and a direct path to the indicators behind it.

Ask DeepAlpha