Waindrops [Makit0]
A custom volume profile indicator that visualizes trading volume across custom time periods, splitting each period into halves and displaying volume and sentiment through color-coded histograms.
Explore 11,183 indicators. Filter beyond the obvious.
Discover the tools that fit the way you trade.
11,183 tools to explore
A custom volume profile indicator that visualizes trading volume across custom time periods, splitting each period into halves and displaying volume and sentiment through color-coded histograms.
A sophisticated market cycle detection method that uses Detrended Price Oscillator to identify rhythmic patterns and dominant cycles in price movements, helping traders optimize technical indicator settings.
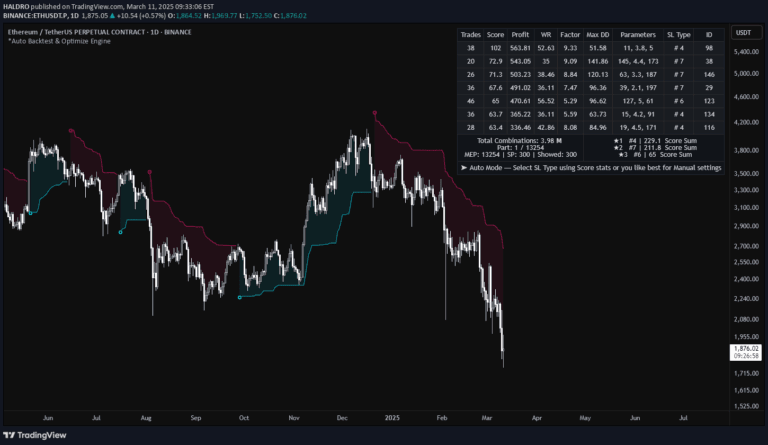
An advanced trading tool that automatically tests millions of parameter combinations for stop-loss and take-profit strategies using genetic algorithms and comprehensive performance analysis.
A trading indicator that identifies pivot points using Rally, Base, and Drop candles to determine supply and demand levels with structured market analysis.
A multi-indicator trading signal combining Stochastic RSI, RSI, and MACD to generate buy and sell signals with color-coded strength indicators.
An advanced volume analysis tool for crypto trading that aggregates volume data across multiple exchanges, offering customizable volume calculation and display methods.
A versatile indicator that displays key trading levels with extensive customization options. Helps traders identify crucial price points and market structure with multiple display settings.
A webhook-triggered trading bot that automatically calculates and triggers trades based on predefined entry, take profit, and stop loss percentages for long and short positions.
A technical analysis tool that identifies price ranges, calculates volume distribution, and detects potential consolidation zones with point of control analysis.
An indicator that identifies fair value gaps in price action by analyzing three consecutive candles, highlighting potential trading opportunities through visual gap representation.
A Pine Script indicator that identifies and labels rally, base, and drop candles to help traders recognize key price action phases and potential market momentum shifts.
A customizable indicator tracking global market sessions, highlighting price ranges and session activities for precise intraday trading analysis and strategic decision-making.
Likes, views, and comments are historical TradingView snapshots. They describe attention, not trading performance.