Volume Delta Candles [LuxAlgo]
Volume Delta Candles analyze intrabar trading activity by comparing buy and sell volumes, providing visual insights into price movement and trading sentiment within each candle.
Explore 11,183 indicators. Filter beyond the obvious.
Discover the tools that fit the way you trade.
11,183 tools to explore
Volume Delta Candles analyze intrabar trading activity by comparing buy and sell volumes, providing visual insights into price movement and trading sentiment within each candle.
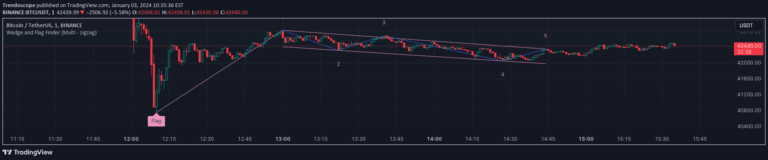
A refined wedge and flag pattern recognition technique using five pivots instead of the standard four, designed to reduce noise and improve pattern identification in trading signals.
Wolfe Pattern is a trading strategy that identifies potential trend reversals by analyzing a specific wedge formation and drawing lines connecting key pivot points to determine entry and exit signals.
A dynamic volume indicator that breaks down buy and sell volume proportions within each candle, showing real-time volume distribution and highlighting which side dominates trading activity.
The Relative Trend Index (RTI) is an advanced technical indicator that measures trend strength by analyzing price positioning within its recent range, offering more adaptive insights than traditional momentum tools.
An advanced indicator analyzing open interest flows and price sentiment using Elder-Ray concept to assess market activity, trader positioning, and potential trend dynamics.
Volume Zones Internal Visualizer is an advanced candle type that reveals lower timeframe volume activity on a higher timeframe chart, highlighting volume zones and peak activity levels.
Advanced AI-powered trading indicator combining pivot analysis, multi-timeframe trend detection, and adaptive signal filtering to identify high-probability trading opportunities across various markets.
Deep Volume provides high-fidelity volume analysis using real-time Tradingview data, offering detailed insights into market dynamics through comprehensive volume metrics and visualization.
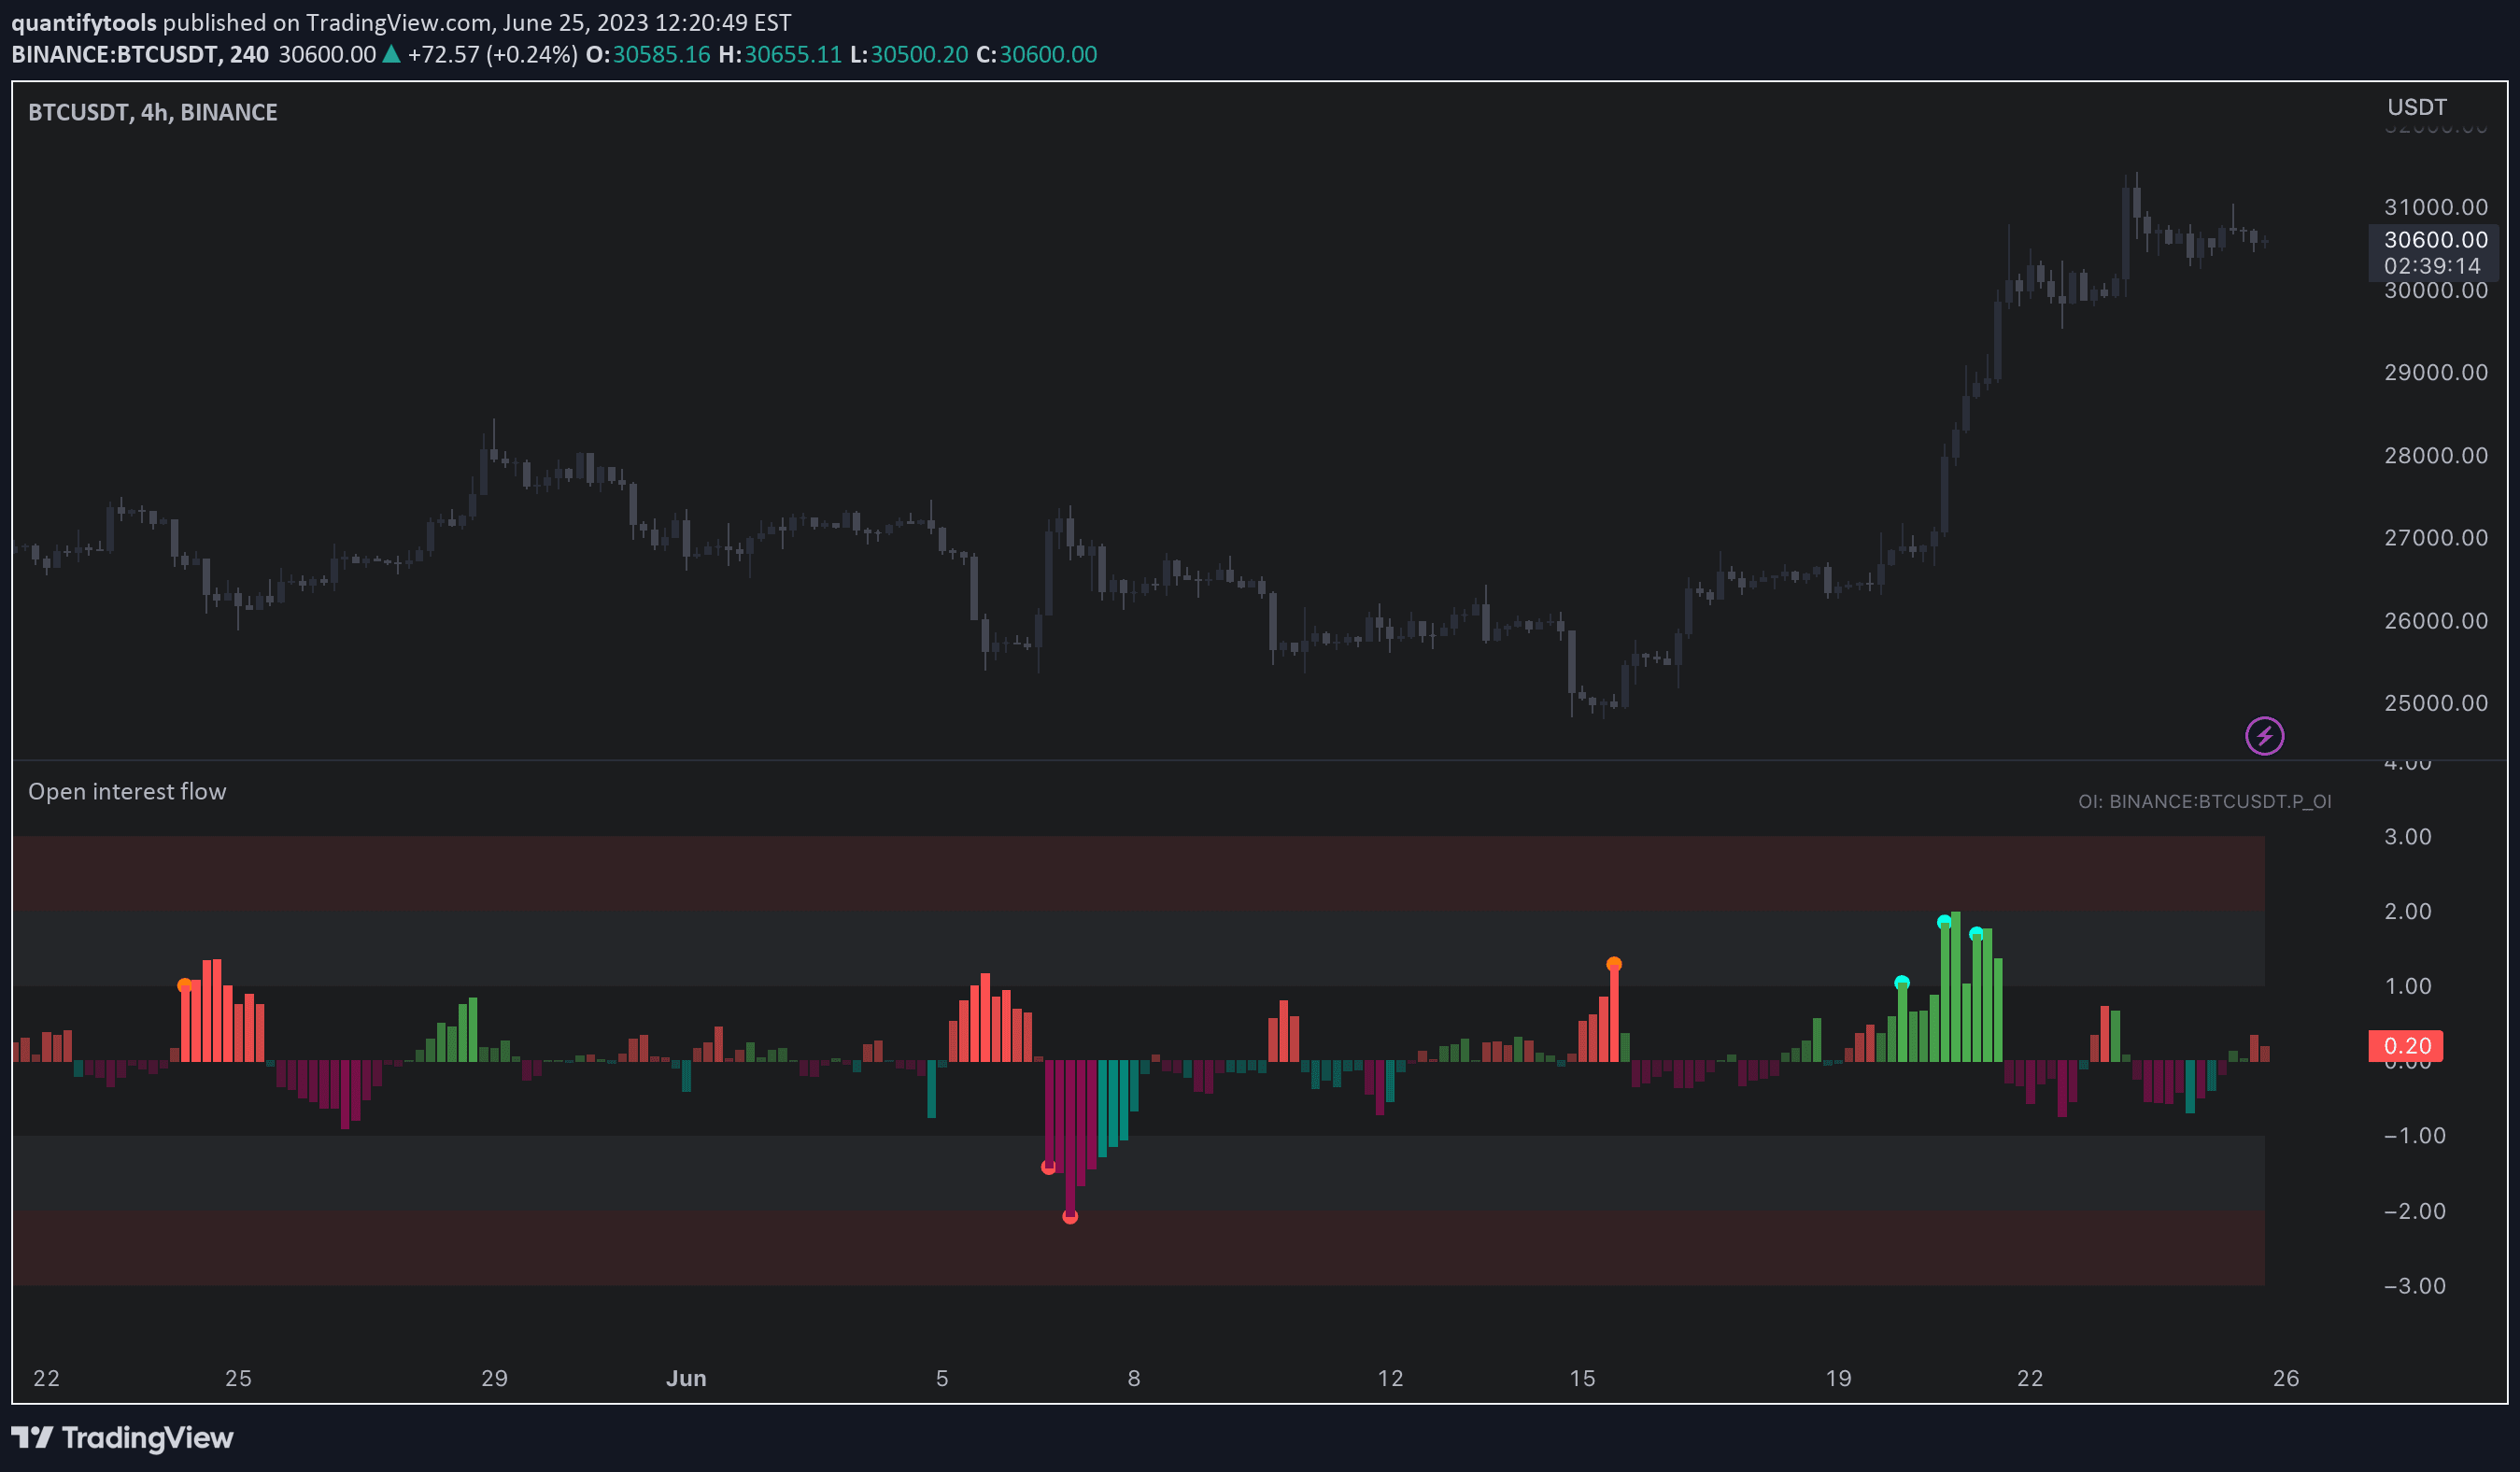
Open interest flow indicator detecting market sentiment by analyzing position openings and closings, revealing potential exuberance or liquidation moments in trading.
A higher timeframe trend mapping tool that visually overlays market structure, trend direction, and price boundaries onto intraday charts for enhanced trading context.
A trend-following indicator combining Simple Moving Averages with Inner Circle Trader concepts to generate precise buy and sell signals based on market structure and trend confirmation.
Likes, views, and comments are historical TradingView snapshots. They describe attention, not trading performance.