Elliott Wave [LuxAlgo]
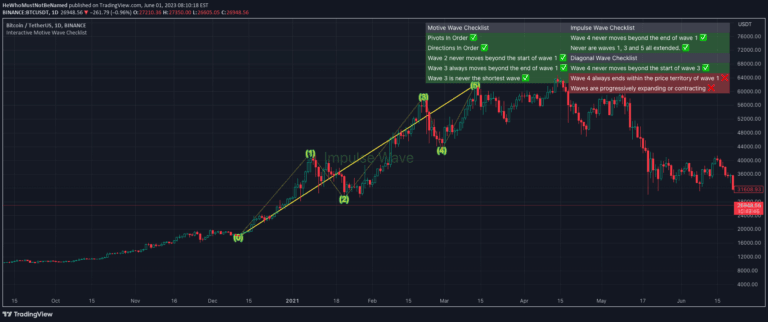
Elliott Wave indicator automatically detects impulse and corrective wave patterns in price movements, helping traders identify potential trend directions and market phases.
Explore 11,183 indicators. Filter beyond the obvious.
Discover the tools that fit the way you trade.
11,183 tools to explore
Elliott Wave indicator automatically detects impulse and corrective wave patterns in price movements, helping traders identify potential trend directions and market phases.
Elliott Wave analysis is a technical trading method that identifies market trends by examining price wave patterns, helping traders predict potential market movements and trend reversals.
Advanced multi-timeframe Zigzag indicator offering recursive wave analysis and pattern recognition across different market timeframes with customizable visualization and tracking capabilities.
A predictive trading indicator that forecasts next candle price movement, combines Elliott Wave analysis, and provides auto-hedging suggestions for risk management.
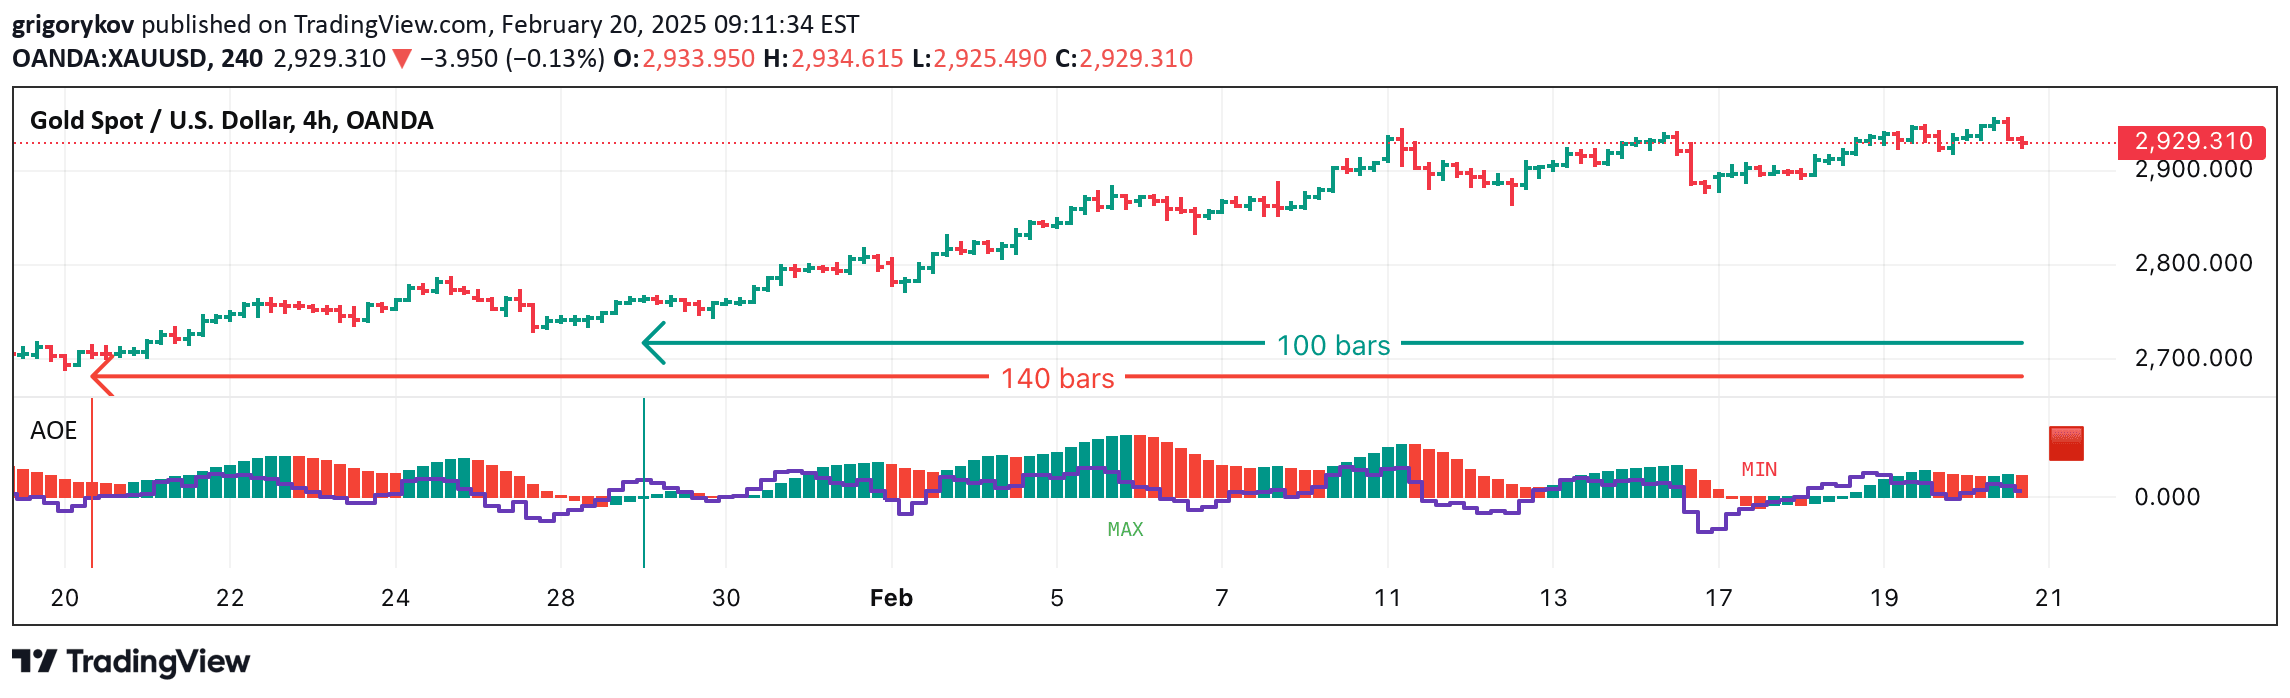
An advanced indicator tracking visible chart bars, displaying Awesome Oscillator values and Elliott Wave peak identification to help traders analyze market dynamics and potential trend movements.
An advanced trading indicator that automatically identifies Elliot Wave patterns and uses Fibonacci ratios to project potential price movements and trend reversals.
An advanced trading indicator combining Awesome Oscillator and EMA lines to identify Elliott wave patterns and price momentum using customizable moving average calculations.
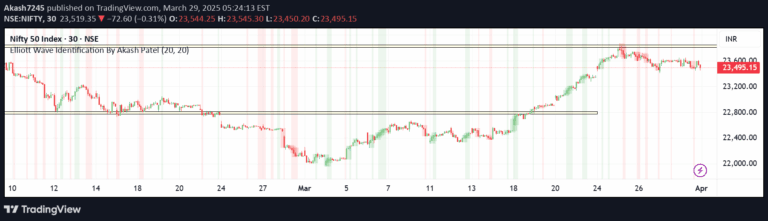
An advanced technical analysis tool that automatically identifies Elliott Wave patterns, projecting potential price movements and trend reversals using complex wave cycle calculations.
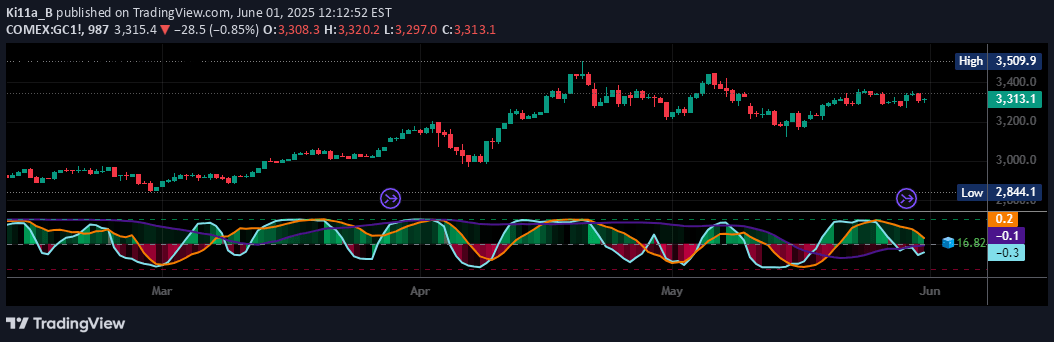
A technical indicator combining Elliott Wave theory with derivative peak detection and breakout bands to analyze market trends and potential reversals through advanced oscillator analysis.
A specialized TradingView indicator that filters market noise in Elliott Wave analysis by combining volatility, volume, trend strength, and fractal pattern recognition techniques.
BK AK-Scope is an advanced trading intelligence system that analyzes market momentum using a Triple-Tier TSI Correlation Engine with adaptive volatility scoring and real-time signal clarity.
A visual indicator that highlights consecutive bullish or bearish candle sequences by applying color backgrounds and drawing transparent boxes to identify market momentum trends.
Likes, views, and comments are historical TradingView snapshots. They describe attention, not trading performance.