LNL Trend System
LNL Trend System is an ATR-based day trading system using trend and stop lines to identify market trends and potential trading opportunities across multiple timeframes.
Explore 11,183 indicators. Filter beyond the obvious.
Discover the tools that fit the way you trade.
11,183 tools to explore
LNL Trend System is an ATR-based day trading system using trend and stop lines to identify market trends and potential trading opportunities across multiple timeframes.
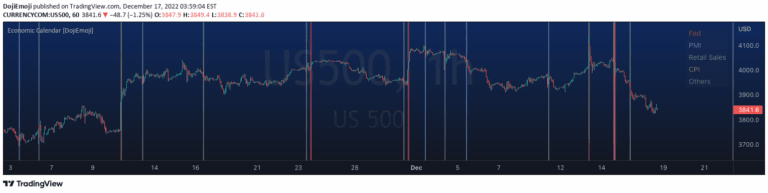
A trading tool that tracks major economic events and their potential market impact, helping traders understand pivotal moments in financial markets.
A trading script that automatically draws vertical lines marking economic calendar events using predefined datetime inputs, helping traders visually track significant market events.
Multi VWAP tool that creates automatic Anchored Volume Weighted Average Price lines from significant market gaps across different time periods, providing insights into market structure and institutional trading dynamics.
An advanced trading tool analyzing U.S. interest rate decisions to generate trading signals across multiple economic periods, helping traders make strategic investment decisions.
A trading tool that tracks and marks high and low price levels for critical economic events like Non-Farm Payrolls and Federal Open Market Committee meetings.
A custom script displaying four EMAs with key market event tracking for New York and London stock exchanges, including FOMC and CPI release dates.
A volume filtering tool that identifies and manages extreme volume candles during market events, helping traders distinguish between genuine trend signals and noise.
A TradingView indicator that plots significant economic event dates like FOMC meetings, CPI releases, and Bitcoin halvings directly on trading charts to help traders stay informed about potential market-moving announcements.
Likes, views, and comments are historical TradingView snapshots. They describe attention, not trading performance.