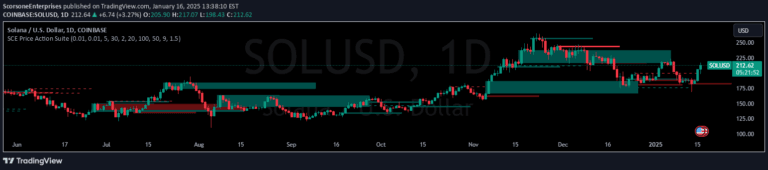
SCE Price Action Suite
A multi-feature trading indicator that analyzes market data using eight different techniques to identify potential price action levels and trading opportunities across various market conditions.
Explore 11,183 indicators. Filter beyond the obvious.
Discover the tools that fit the way you trade.
11,183 tools to explore
A multi-feature trading indicator that analyzes market data using eight different techniques to identify potential price action levels and trading opportunities across various market conditions.
TTM indicator helps traders understand price direction and market volatility by tracking price movements relative to a dynamic moving average and identifying potential trend changes.
Prometheus Trend Lines is an automated tool that plots dynamic support and resistance trend lines on charts, helping traders identify potential price movement zones and trend strength.
A trading signal that uses Sum of Squared Errors to identify potential market reversals by analyzing price memory and detecting changes in market dynamics.
SCE GANN Predictions is a technical indicator that forecasts price direction by calculating velocity and optimizing a prediction ratio using historical price data.
A Markov Chain-based indicator that predicts potential price movements by analyzing historical state transitions and calculating probabilities of future market states.
A Hawkes Process-based trading indicator that estimates bid and ask side excitability to predict potential market direction and order flow dynamics.
A trading tool that tracks and marks high and low price levels for critical economic events like Non-Farm Payrolls and Federal Open Market Committee meetings.
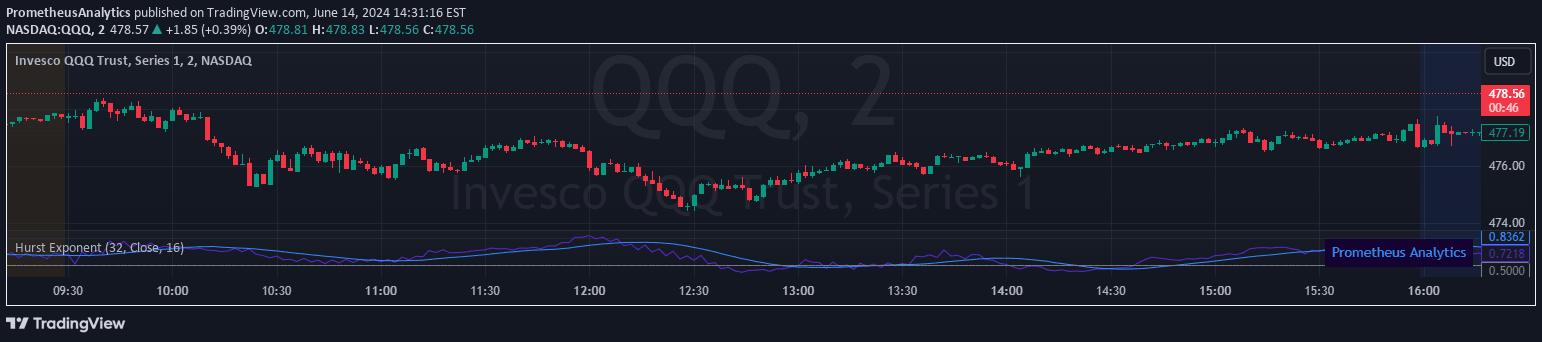
The Hurst Exponent indicator helps traders understand market behavior by analyzing long-term memory and potential trend characteristics through a value ranging from 0 to 1.
A fractal-based indicator that identifies potential price reversals by analyzing price highs and lows across multiple bars and calculating wave distances.
An entropy indicator that measures price return randomness and market complexity, revealing market uncertainty and potential trend strength through log return distribution analysis.
A stochastic model using Ornstein-Uhlenbeck process and Kalman filter to analyze order flow momentum, revealing dynamic buying and selling pressure in financial markets.
Likes, views, and comments are historical TradingView snapshots. They describe attention, not trading performance.