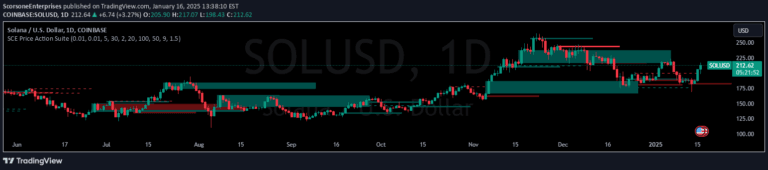
SCE GANN Predictions is a technical indicator that forecasts price direction by calculating velocity and optimizing a prediction ratio using historical price data.
Explore complementary indicator rolesHow it works
The SCE GANN Predictions indicator calculates price velocity by measuring the average difference between close and open prices over a specified lookback period. It then predicts future prices by scaling this velocity using an optimized ratio.
The script tests multiple ratio values to find the one with the lowest sum of squared errors against historical prices. The prediction is smoothed using a simple moving average (SMA) that changes color based on current price position, indicating bullish (teal) or bearish (red) trends
Why it may be useful
This indicator provides traders with a dynamic trend line that helps identify potential market direction and momentum. By analyzing historical price behavior and calculating a predictive value, it offers insights into possible future price movements.
The color-coded SMA makes it easy to quickly understand market sentiment at a glance. The flexible inputs allow traders to customize the analysis for different market conditions and trading styles, making it a versatile tool for technical analysis
When to explore it
The SCE GANN Predictions indicator works best in markets with clear trending characteristics. It is most effective when price shows consistent momentum in a particular direction. Traders should use it alongside other confirmation indicators to validate signals.
It may be less reliable during periods of sideways or choppy market conditions. The indicator is particularly useful for day traders and swing traders looking to understand short to medium-term price trends and potential reversals
Keep exploring
What we’ve verified
Access, alerts and repainting behaviour have not been independently verified for this indicator. Check the creator’s current publication and settings.
General descriptions and classifications are recovered research. Verified details above identify the specific checks we have completed. Check the creator’s current publication for later changes.