YOUR INDICATOR RESEARCH STARTS HERE

Find the right indicator.
Understand what it does.

Explore 11,183 indicators. Filter beyond the obvious.
Discover the tools that fit the way you trade.

THE INDICATOR LIBRARY

Results for “MOM”

11,183 tools to explore

422 indicators matching your filters
Save search
MomentumEditor’s pick

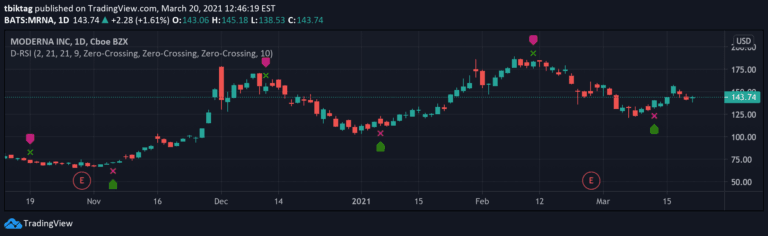
Delta-RSI Oscillator Strategy

by tbtkg

Delta-RSI Oscillator is a momentum indicator that measures the rate of change in RSI through a smoothed time derivative, providing dynamic insights into market momentum shifts.

Separate pane · unverifiedDay Trading · Swing Trading
Explore
6.5Klikes216.5Kviews72comments
Save
MomentumEditor’s pick

Momentum Acceleration by DGT

by dgtrd

A momentum-based trading signal that measures price changes over time, using speed and acceleration principles to identify potential trend directions and trading setups.

Separate pane · unverifiedDay Trading · Swing Trading
Explore
5Klikes159.1Kviews131comments
Save
VolumeMomentumEditor’s pick

Neglected Volume by DGT

by dgtrd

A comprehensive volume analysis tool that examines trading volume dynamics, measuring market participation, interest, and potential price movement signals through multiple volume-based indicators.

Separate pane · unverifiedDay Trading · Swing Trading
Explore
4.4Klikes113.5Kviews129comments
Save
MomentumEditor’s pick

Stochastic Heat Map

by Violent

A multi-timeframe stochastic oscillator system using 28 different stochastic lengths to analyze market momentum and generate trading signals through color-coded visualization.

Separate pane · unverifiedSwing Trading
Explore
4.2Klikes121.6Kviews87comments
Save
TrendMomentumEditor’s pick

RedK Momentum Bars (RedK Mo_Bars)

by RedKTrader

Momentum Bars (Mo_Bars) is a three-moving average based indicator that visualizes relative momentum changes, helping traders identify potential trend shifts and momentum direction.

Separate pane · unverifiedDay Trading · Swing Trading
Explore
4.1Klikes116.9Kviews64comments
Save
MomentumVolatilityEditor’s pick

(JS) Squeeze Pro Overlays

by J-Streak

A multi-feature trading signal indicator that identifies market squeeze conditions using Bollinger Bands and Keltner Channels with customizable overlay options for entry and exit signals.

Main price chart · unverifiedDay Trading · Swing Trading
Explore
3.6Klikes73.8Kviews31comments
Save
MomentumOscillatorSignal

Parabolic RSI [ChartPrime]

by ChartPrime

Parabolic RSI combines Parabolic SAR with Relative Strength Index to identify momentum shifts and potential trend reversals using a unique diamond-based signal system.

Separate pane · unverifiedScalping · Day Trading
Explore
3.4Klikes45Kviews17comments
Save

Likes, views, and comments are historical TradingView snapshots. They describe attention, not trading performance.

START WITH A QUESTION

A little less searching.
A lot more understanding.

Tell DeepAlpha what you need. Get an explanation, a shortlist,
and a direct path to the indicators behind it.

Ask DeepAlpha