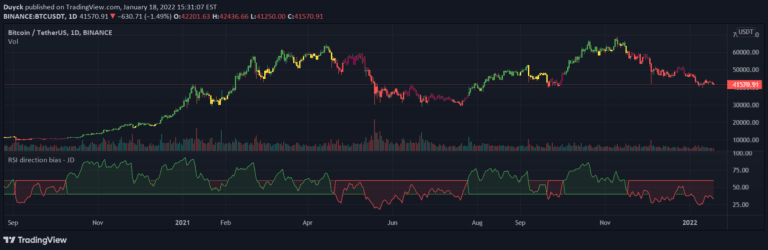
Divergence Indicator (any oscillator)
A versatile divergence indicator that identifies potential trend reversals by comparing price action with an oscillator's momentum, adaptable to multiple technical indicators.
Explore 11,183 indicators. Filter beyond the obvious.
Discover the tools that fit the way you trade.
11,183 tools to explore
A versatile divergence indicator that identifies potential trend reversals by comparing price action with an oscillator's momentum, adaptable to multiple technical indicators.
The Ultimate RSI is an advanced oscillator that enhances traditional RSI by emphasizing trend dynamics, providing more precise insights into market momentum and directional movements.
Twin Range Filter is an advanced trend indicator that creates dynamic upper and lower ranges using exponential moving averages to generate buy and sell signals based on price crossovers.
A comprehensive divergence analysis tool that calculates divergence strength across multiple indicators, providing a single metric to assess potential market reversals and trend shifts.
A multi-timeframe stochastic oscillator system using 28 different stochastic lengths to analyze market momentum and generate trading signals through color-coded visualization.
An adaptive MACD oscillator that dynamically adjusts to market conditions, filtering noise and capturing trend variations by interpolating between different filter coefficients.
An advanced MACD variant that normalizes momentum measurements and uses Heikin-Ashi candles to provide smoother trend analysis across different assets and timeframes.
A comprehensive trading tool that helps traders analyze oscillators by converting their values into a visual channel, revealing trend strength, divergences, and potential trading signals across various market conditions.
A momentum indicator that uses Hull Moving Average to track price shifts, creating dynamic five-level zones that highlight momentum strength and potential trend changes.
The Bollinger Band Width Percentile measures relative volatility by calculating the percentage of historical periods where Bollinger Band width was narrower than the current period.
A simple market bias indicator designed to help traders filter potential trades, identify market direction, and discover potential entry points during pullbacks with minimal complexity.
A dynamic trend analysis tool that measures market momentum by tracking wave sizes, speed, and trend direction using advanced moving average techniques.
Likes, views, and comments are historical TradingView snapshots. They describe attention, not trading performance.