Parabolic SAR + EMA 200 + MACD Signals
A comprehensive trading indicator combining Parabolic SAR, EMA 200, and MACD to generate precise buy and sell signals by analyzing market trends and momentum.
Explore 11,183 indicators. Filter beyond the obvious.
Discover the tools that fit the way you trade.
11,183 tools to explore
A comprehensive trading indicator combining Parabolic SAR, EMA 200, and MACD to generate precise buy and sell signals by analyzing market trends and momentum.
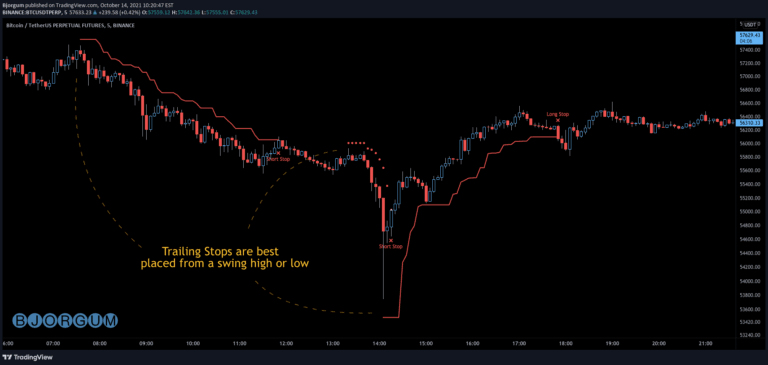
A versatile trailing stop management script for crypto and forex traders, offering multiple trail types to protect profits and manage risk dynamically during ongoing trades.
A multi-level trend classification tool that detects market momentum using adaptive smoothing, color-coded candles, and dynamic trend bands to help traders identify trend strength and potential reversals.
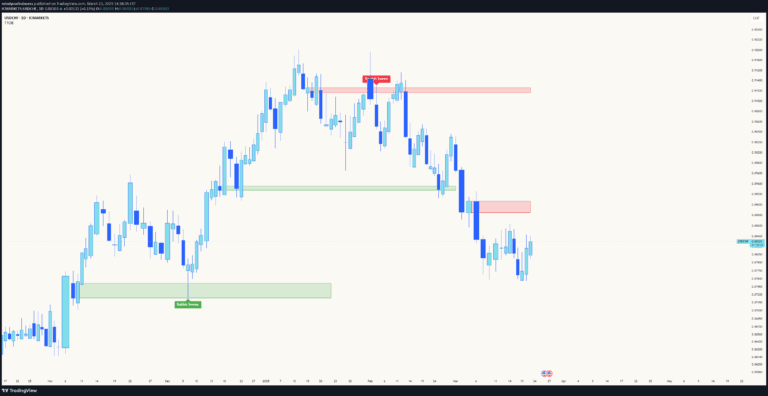
The Trapped Traders Order Blocks indicator identifies potential market reversals by detecting scenarios where large traders are caught in losing positions, signaling possible trend changes.
Kalman PSaR combines Parabolic SAR with Kalman Filter to create a dynamic trend-following indicator that reduces noise and improves signal accuracy for traders.
An advanced PSAR oscillator that standardizes and enhances trend analysis by combining PSAR with EMA and WMA techniques to provide clearer market trend and reversal signals.
Parabolic Support Resistance (PSAR SR) identifies dynamic reversal points in price, plotting support and resistance levels to help traders confirm potential trend changes and entry points.
A multi-indicator trading tool combining Supertrend, HalfTrend, Ichimoku Cloud, and Parabolic SAR to provide comprehensive trend and reversal analysis with a unique Master Candle feature.
A sophisticated Parabolic SAR indicator that helps traders identify optimal entry zones by displaying two different SAR indicators with customizable parameters.
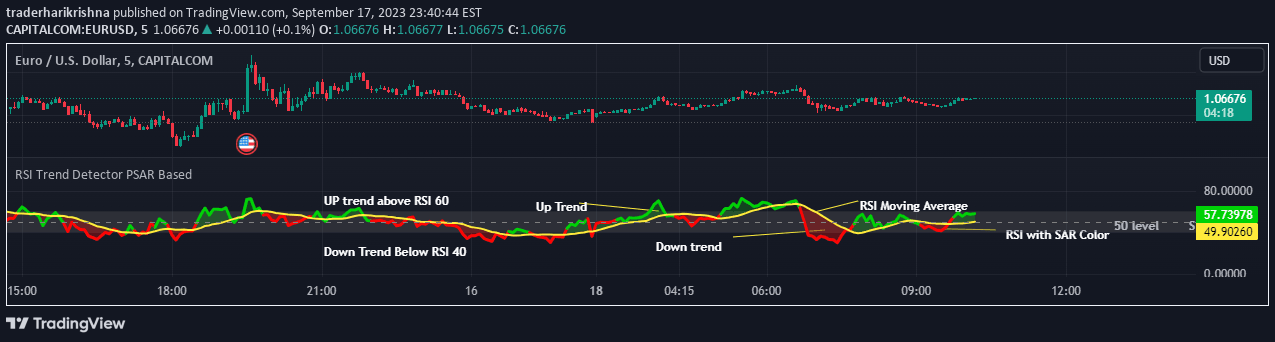
RSI Trend Detector combines RSI with PSAR to identify market trend direction, providing clear signals for entry points and trend strength using color-coded indicators.
An advanced trading indicator that identifies liquidity sweeps and price rejections using pivot points, providing precise entry and exit signals across multiple trading timeframes.
A trading strategy that uses Parabolic Stop and Reverse with dynamic support and resistance levels to generate more accurate buy and sell signals by focusing on price breakouts.
Likes, views, and comments are historical TradingView snapshots. They describe attention, not trading performance.