
YOUR INDICATOR RESEARCH STARTS HERE

Find the right indicator.
Understand what it does.

Explore 11,183 indicators. Filter beyond the obvious.
Discover the tools that fit the way you trade.

THE INDICATOR LIBRARY

Results for “R-Squared Method”

11,183 tools to explore

4 indicators matching your filters
Save search
TrendVolatilityChannels

Log Regression Channel [UAlgo]

by UAlgo

A logarithmic regression channel that analyzes price trends by transforming data and plotting a central regression line with deviation bands to identify potential support and resistance levels.

Main price chart · unverifiedScalping · Day Trading
Explore
427likes8.1Kviews0comments
Save
TrendMomentumEditor’s pick

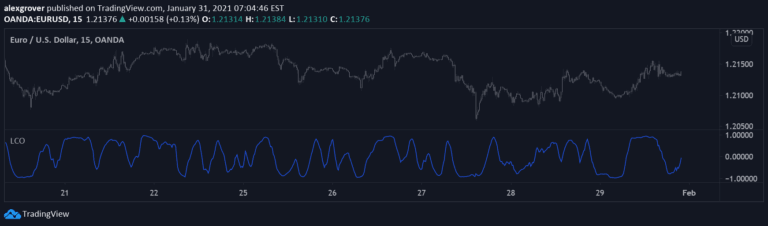
Linear Correlation Oscillator

by alexgrover

A technique for computing rolling correlation between an input series and linear sequence, providing insights into trend dynamics and regression analysis using moving average techniques.

Separate pane · unverifiedDay Trading · Swing Trading
Explore
419likes13.7Kviews4comments
Save
SignalTrend

Smoothing R-Squared Comparison

by simwai

A comparative analysis of smoothing techniques using R-squared values to evaluate different price smoothing algorithms and their effectiveness in identifying market trends.

Separate pane · unverifiedDay Trading · Swing Trading
Explore
45likes2.4Kviews1comments
Save

Likes, views, and comments are historical TradingView snapshots. They describe attention, not trading performance.

START WITH A QUESTION

A little less searching.
A lot more understanding.

Tell DeepAlpha what you need. Get an explanation, a shortlist,
and a direct path to the indicators behind it.

Ask DeepAlpha