Breakout Probability (Expo)
Breakout Probability indicator calculates the likelihood of new market highs or lows by analyzing historical price action and displaying percentage probabilities for potential price levels.
Explore 11,183 indicators. Filter beyond the obvious.
Discover the tools that fit the way you trade.
11,183 tools to explore
Breakout Probability indicator calculates the likelihood of new market highs or lows by analyzing historical price action and displaying percentage probabilities for potential price levels.
A trading indicator tracking institutional investor actions by calculating probabilities of market structure changes and order flow direction for strategic trading decisions.
A tool that identifies potential price reversal zones using statistical probability by analyzing historical swing points and calculating precise percentile-based predictions.
A statistical trailing stop tool that uses log-normal distribution of volatility to help traders lock in profits across different market conditions and trend strengths.
An advanced trading indicator that tracks market structure, swing points, order blocks, and fair value gaps to identify potential trend reversals and continuation patterns in real-time.
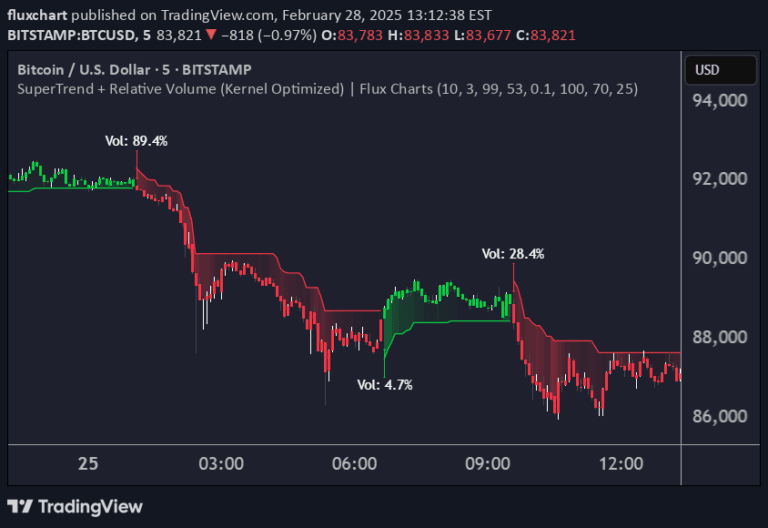
An advanced trading indicator combining Supertrend and Relative Volume using Kernel Density Estimation to predict trend breaks with probabilistic precision and volume confirmation.
A sophisticated trading indicator using Bayesian probability theory and multiple moving averages to assess market trends and predict potential price direction with statistical precision.
A probabilistic grid tool that visualizes potential price reversal locations using a 10x10 matrix, helping traders understand the likelihood of future market movements.
A neural network-enhanced RSI indicator that uses advanced smoothing techniques to generate precise trading signals across different market conditions and visualization modes.
A trend reversal probability indicator that uses custom oscillator calculations to estimate market direction shifts and potential trend changes with statistical probability analysis.
A probability cone is a statistical forecast indicator that visualizes potential price distribution using standard or Laplace distributions, helping traders understand potential price movement ranges.
A MACD-based trading indicator that generates buy and sell signals by analyzing moving average crossovers, with support and resistance levels to confirm potential trade entries.
Likes, views, and comments are historical TradingView snapshots. They describe attention, not trading performance.