YOUR INDICATOR RESEARCH STARTS HERE

Find the right indicator.
Understand what it does.

Explore 11,183 indicators. Filter beyond the obvious.
Discover the tools that fit the way you trade.

THE INDICATOR LIBRARY

Results for “RVI”

11,183 tools to explore

44 indicators matching your filters
Save search
MomentumOscillatorTrend

MACD & RSI Overlay (Expo)

by Zeiierman

A technical analysis tool combining MACD and RSI overlaid on price charts, offering traders insights into market momentum, trend direction, and potential trade signals.

Main price chart · unverifiedScalping · Day Trading
Explore
3.2Klikes92Kviews28comments
Save
SignalTrend

Market Monitor

by finallynitin

A dynamic market overview tool that tracks percentage changes across multiple indices or sectors, allowing traders to quickly assess performance and trends across different timeframes.

Separate pane · unverifiedDay Trading · Swing Trading
Explore
1.8Klikes18.6Kviews9comments
Save
MomentumOscillatorSignal

RSI Exponential Smoothing (Expo)

by Zeiierman

RSI Exponential Smoothing is an advanced indicator that combines RSI and EMA to provide clearer trading signals, helping traders identify trend reversals and potential entry/exit points.

Separate pane · unverifiedScalping · Day Trading
Explore
1.6Klikes33.4Kviews17comments
Save
MomentumOscillatorSignal

RSI Order Blocks [UAlgo]

by UAlgo

RSI Order Blocks is a trading indicator that identifies potential support and resistance zones using the Relative Strength Index, helping traders visualize key price areas with customizable detection parameters.

Separate pane · unverifiedScalping · Day Trading
Explore
1.4Klikes37.1Kviews24comments
Save
TrendMomentumEditor’s pick

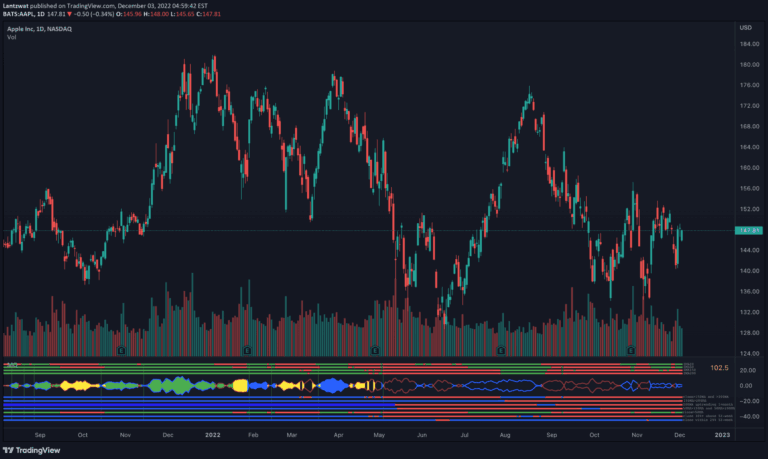
Minervini Qualifier

by Lantzwat

Minervini Qualifier is a stock screening indicator that evaluates price momentum, trend strength, and relative performance against a benchmark index.

Main price chart · unverifiedSwing Trading
Explore
1Klikes42.6Kviews21comments
Save
TrendSignal

Mark Minervini's Trend Template

by OmkarBanne

A comprehensive stock market trend indicator developed by Mark Minervini that assesses multiple moving average relationships and price positioning to identify potential bullish market conditions.

Main price chart · unverifiedSwing Trading
Explore
705likes9.6Kviews7comments
Save
OscillatorSignalVolume

Volume Breakout [Afnan]

by AfnanTAjuddin

The Relative Volume / Volume Breakout Multiplier (RVI) helps traders analyze volume dynamics by quantifying volume breakouts relative to the Simple Moving Average.

Separate pane · unverifiedScalping · Day Trading
Explore
451likes9.5Kviews9comments
Save
SignalTrend

Minervini Stage 2 Analysis

by JS_TechTrading

A trading strategy identifying bullish stock trends by analyzing moving average relationships and positioning to capture medium-term price movements in upward trending stocks.

Main price chart · unverifiedSwing Trading
Explore
385likes9.7Kviews1comments
Save
SignalVolume

BTC Coinbase Premium

by traderview2

A trading signal that compares Bitcoin prices between Coinbase and Binance, revealing price premiums or discounts by tracking price differences across exchanges.

Separate pane · unverifiedScalping · Day Trading
Explore
343likes4Kviews1comments
Save
VolatilitySignalLevels

Smarter Money Concepts - MTF IFVGs [PhenLabs]

by PhenLabs

A multi-timeframe indicator that identifies Inverse Fair Value Gaps (IFVGs) across chart intervals, helping traders spot liquidity voids and potential reversal zones using institutional order flow patterns.

Main price chart · unverifiedScalping · Day Trading
Explore
246likes6.3Kviews2comments
Save
TrendMomentumOscillator

AII - Average indicator of indicators

by MrCancio

A comprehensive technical analysis tool combining multiple popular indicators like RSI, RVI, and Stochastic RSI to provide a multi-dimensional view of market momentum and trend strength.

Separate pane · unverifiedScalping · Day Trading
Explore
169likes9.7Kviews5comments
Save

Likes, views, and comments are historical TradingView snapshots. They describe attention, not trading performance.

START WITH A QUESTION

A little less searching.
A lot more understanding.

Tell DeepAlpha what you need. Get an explanation, a shortlist,
and a direct path to the indicators behind it.

Ask DeepAlpha