Auto Chart Patterns [Trendoscope®]
An advanced algorithmic indicator that automatically identifies and classifies complex chart patterns by analyzing trend lines, pivot points, and geometric formations across multiple timeframes.
Explore 11,183 indicators. Filter beyond the obvious.
Discover the tools that fit the way you trade.
11,183 tools to explore
An advanced algorithmic indicator that automatically identifies and classifies complex chart patterns by analyzing trend lines, pivot points, and geometric formations across multiple timeframes.
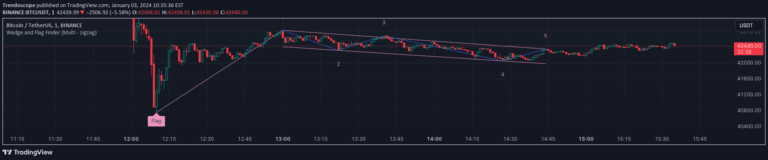
A refined wedge and flag pattern recognition technique using five pivots instead of the standard four, designed to reduce noise and improve pattern identification in trading signals.
A trading signal that combines trend bias, oscillator analysis, and divergence detection to help traders make more informed decisions about trend continuation, reversal, and potential profit-taking.
A modified Supertrend indicator that adjusts ATR calculations based on candle colors to provide more precise stop loss and trend tracking in volatile markets.
A multi-level moving average strategy that identifies trend strength by analyzing recursive moving averages across multiple levels, providing insights into market trend direction and potential reversals.
Wolfe Pattern is a trading strategy that identifies potential trend reversals by analyzing a specific wedge formation and drawing lines connecting key pivot points to determine entry and exit signals.
A comprehensive harmonic pattern recognition tool that identifies multiple chart patterns using zigzag indicators, helping traders detect potential trend reversals and continuation signals.
A trading script that projects future pivot points by analyzing historical price patterns and calculating potential next pivot locations using statistical analysis of market movements.
ABC Pattern is a three-wave corrective trading indicator that identifies potential trend reversals and price movements by analyzing impulse and corrective waves in market trends.
A trading signal that identifies support and resistance levels using zigzag patterns, divergence detection, and oscillator analysis to highlight potential trend reversals and market momentum shifts.
A trend-following trading signal that uses harmonic patterns to identify bullish and bearish zones by analyzing price movement across five confirmed pivot points.
A comprehensive indicator that scans and highlights multiple reversal chart patterns like Double Tops, Cup and Handles, and Head and Shoulders using recursive zigzag analysis.
Likes, views, and comments are historical TradingView snapshots. They describe attention, not trading performance.