Linear Regression Oscillator [ChartPrime]
A custom indicator using linear regression to analyze closing prices, helping traders identify market trends, mean reversion, and potential overbought or oversold conditions across different timeframes.
Explore 11,183 indicators. Filter beyond the obvious.
Discover the tools that fit the way you trade.
11,183 tools to explore
A custom indicator using linear regression to analyze closing prices, helping traders identify market trends, mean reversion, and potential overbought or oversold conditions across different timeframes.
Fair Value Gaps (FVG) identify market imbalances between buyers and sellers, highlighting potential support and resistance levels where price movements might reverse or continue.
Auto-generated Fibonacci Retracements that identify market structure shifts and potential support/resistance zones based on technical breaks and price action dynamics.
Volume Delta Candles analyze intrabar trading activity by comparing buy and sell volumes, providing visual insights into price movement and trading sentiment within each candle.
A volume heat map indicator that colors volume bars and candles based on the standard deviation of trading volume from its average. Provides visual insights into volume intensity and potential market significance.
Renko Candles Overlay is a charting technique that transforms price action into uniform-sized bricks, offering a simplified visual representation of market trends and price movements.
A multi-timeframe Fair Value Gap indicator that identifies market imbalances and potential price targets by highlighting gaps between price candles across different timeframes.
SwingArms is a color-coded trend indicator that visually confirms market trend changes using green and red signals for bullish and bearish movements respectively.
Periodic Linear Regressions (PLR) calculates linear trend lines over customizable periods, helping traders identify underlying price trends and potential support/resistance zones.
A comprehensive trading framework designed to help traders develop, analyze, and manage trading strategies with advanced risk and reward tracking capabilities across multiple market conditions.
A custom volume profile indicator that visualizes trading volume across custom time periods, splitting each period into halves and displaying volume and sentiment through color-coded histograms.
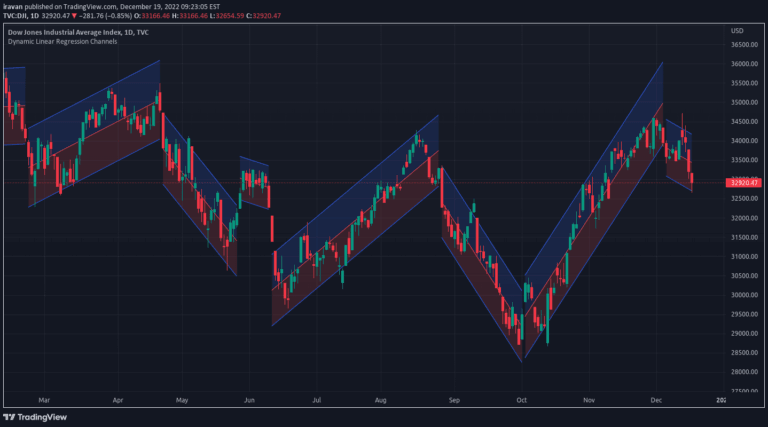
A dynamic linear regression channel indicator that adapts to price movements by creating new channels when previous channels break, helping traders identify trend changes and key price levels.
Likes, views, and comments are historical TradingView snapshots. They describe attention, not trading performance.