(Quartile Vol.; Vol. Aggregation; Range US Bars; Gaps) [Kioseff]
A multi-chart trading indicator analyzing price action, volume distribution, and market structure through quartile analysis, range US charts, volume aggregation, and gap tracking.
Explore 11,183 indicators. Filter beyond the obvious.
Discover the tools that fit the way you trade.
11,183 tools to explore
A multi-chart trading indicator analyzing price action, volume distribution, and market structure through quartile analysis, range US charts, volume aggregation, and gap tracking.
A precise indicator that identifies supply and demand zones by aggregating price data into synthetic candles, helping traders detect potential market reversal and breakout levels.
An advanced market structure indicator that analyzes price patterns, identifies trend shifts, and highlights supply and demand zones using ZigZag and Break of Structure techniques.
A comprehensive global liquidity tracking tool that aggregates monetary data from 13 major economies, providing insights into financial market trends and potential asset price movements.
A comprehensive economic indicator aggregation tool that normalizes multiple financial metrics to provide a holistic view of market conditions and economic health.
A dynamic support and resistance zone indicator that combines price bars into synthetic candles, highlighting key market levels and potential trading opportunities through visual and customizable zones.
An advanced volume analysis tool that tracks effective volume by measuring volume alignment with price direction, helping traders understand trend strength and potential market shifts.
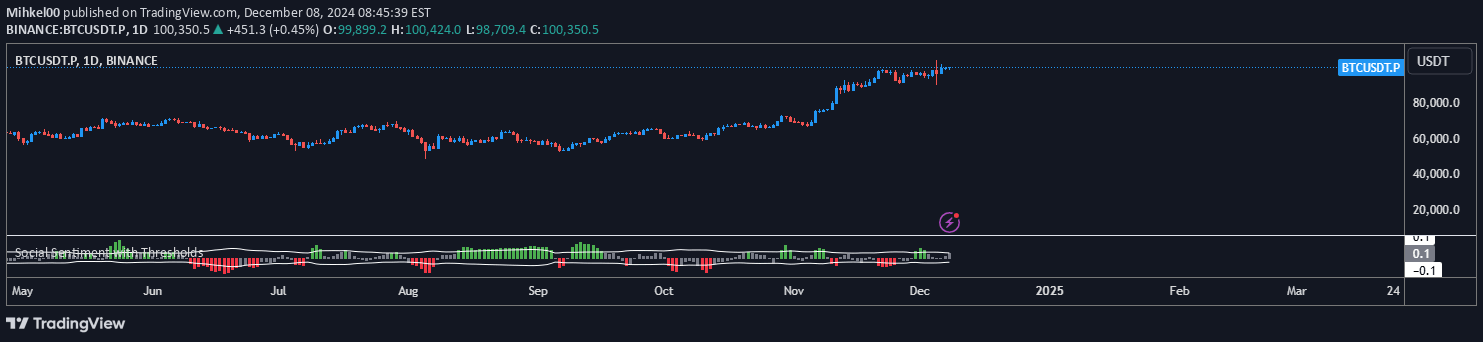
A social sentiment indicator that aggregates and normalizes sentiment data from Telegram and LunarCrush, providing insights into market psychology and potential price action.
Global money supply aggregation tracking monetary dynamics across major economies, providing insights into economic trends and potential market movements through currency and financial indicators.
A price action reconstruction technique using Lanczos resampling to preserve detailed market movements across different timeframes, enhancing traditional candle aggregation methods.
A trading script that aggregates volume data from multiple major centralized cryptocurrency exchanges to provide a comprehensive view of trading activity for a specific trading symbol.
A tool that creates synthetic aggregated candles by combining multiple bars into one, offering traders a broader perspective of price action without changing timeframes.
Likes, views, and comments are historical TradingView snapshots. They describe attention, not trading performance.