Machine Learning: Gaussian Process Regression [LuxAlgo]
Gaussian Process Regression (GPR) is a machine learning method for forecasting price trends by analyzing recent price observations and estimating underlying market movements.
Explore 11,183 indicators. Filter beyond the obvious.
Discover the tools that fit the way you trade.
11,183 tools to explore
Gaussian Process Regression (GPR) is a machine learning method for forecasting price trends by analyzing recent price observations and estimating underlying market movements.
A parametric moving average with adjustable lag and overshoot, providing customizable trend analysis and potential reversal points using a modified sinewave kernel.
A hybrid indicator combining half-trend methodology with Heikin Ashi candles to detect market trends, reversals, and measure trend strength through advanced price analysis.
A comprehensive Bitcoin trading model that combines power law trend, rainbow chart, and halving cycle wave to provide insights into potential price movements and market cycles.
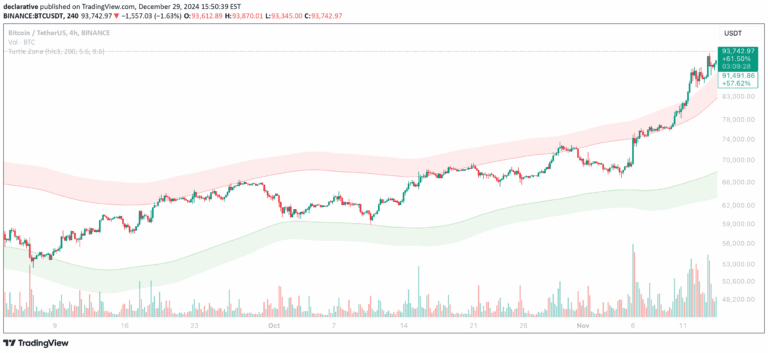
Turtle Zone is a dynamic channel indicator that uses volatility-adaptive moving average bands to identify potential support, resistance, and price movement zones.
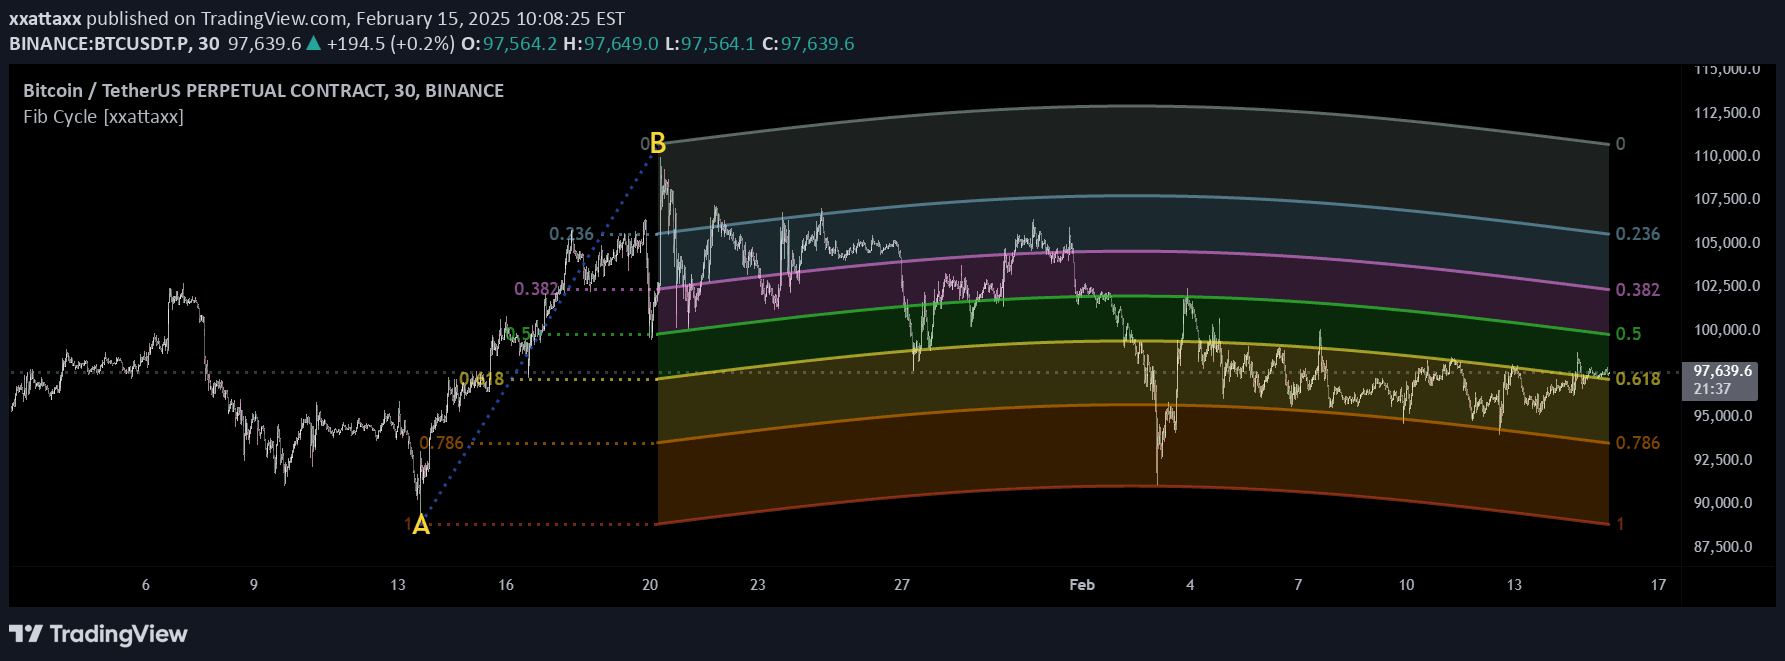
A dynamic Fibonacci analysis tool that transforms traditional retracement levels into wave-based cycles, offering a non-linear approach to understanding market structure and price movements.
Advanced technical indicator using Goertzel algorithm to detect and analyze dominant market cycles, helping traders identify underlying price movement patterns and potential trading opportunities.
The Goertzel Browser is an advanced technical analysis indicator that detects and analyzes dominant market cycles, helping traders identify underlying price movement patterns and potential future trends.
Bitcoin wave model uses logarithmic regression and sinusoidal waves to predict price movements based on halving events, creating a predictive channel for cryptocurrency price forecasting.
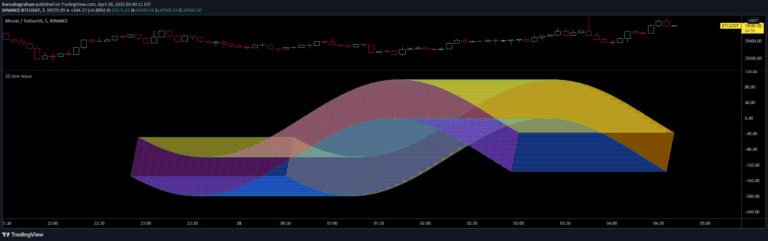
A unique 3D sine wave visualization that allows traders to create dynamic visual representations of market data by mapping inputs to a moving cube following a sine wave pattern.
A Money Flow Index-based indicator that analyzes market trends and strength by incorporating price and volume data to help traders identify potential trend reversals and continuation points.
An adaptive moving average indicator that dynamically adjusts to market conditions, using Laplace transformation and MESA techniques to identify and track market trends effectively.
Likes, views, and comments are historical TradingView snapshots. They describe attention, not trading performance.