Machine Learning: ARIMA + SARIMA
Advanced statistical models using machine learning to forecast price movements by analyzing historical data trends and seasonal patterns through autoregressive and moving average techniques.
Explore 11,183 indicators. Filter beyond the obvious.
Discover the tools that fit the way you trade.
11,183 tools to explore
Advanced statistical models using machine learning to forecast price movements by analyzing historical data trends and seasonal patterns through autoregressive and moving average techniques.
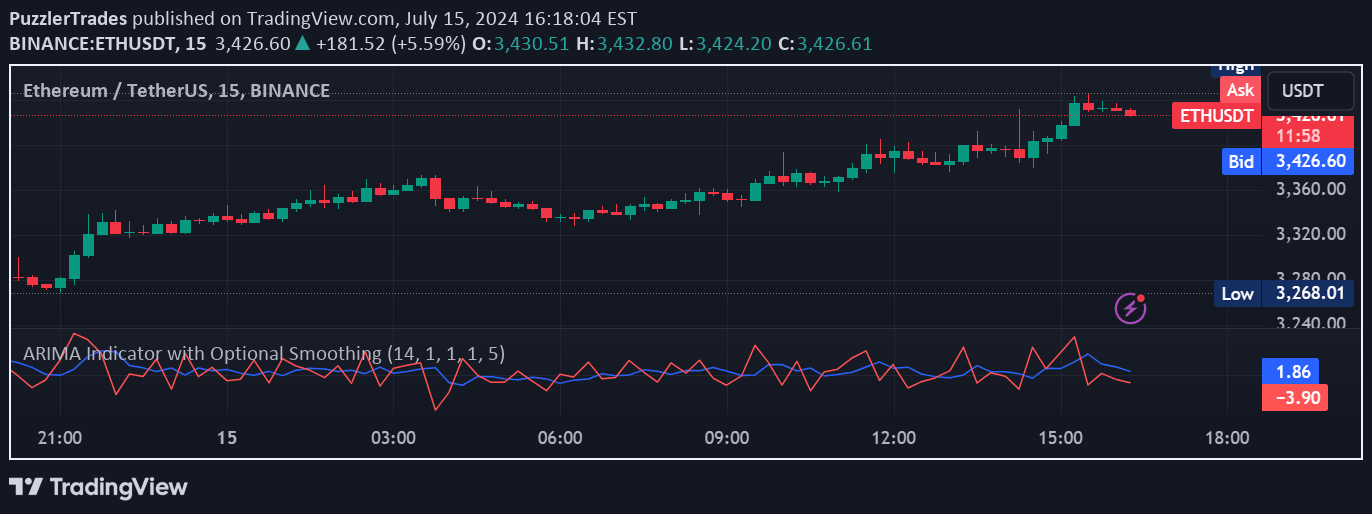
ARIMA is a time series forecasting model that analyzes historical price data to predict future price movements and provide confidence intervals for potential trend directions.
SPTS is a comprehensive statistical trading package offering advanced mathematical functions including t-tests, correlations, regressions, and distribution analysis for traders seeking deeper quantitative insights.
A multi-method candle prediction indicator offering various analytical approaches like linear regression, stochastics, RSI, MFI, EMA, and ARIMA modeling for comprehensive market analysis.
ARIMA Indicator forecasts price movements by analyzing historical data, combining autoregressive and moving average components to predict future trends and potential reversals.
A pin bar highlighter that identifies potential price reversal points by detecting specific candle formations with unique wick and body characteristics.
A multi-timeframe moving average strategy that generates buy/sell signals by analyzing price crossovers and trend alignment across different time frames.
Likes, views, and comments are historical TradingView snapshots. They describe attention, not trading performance.