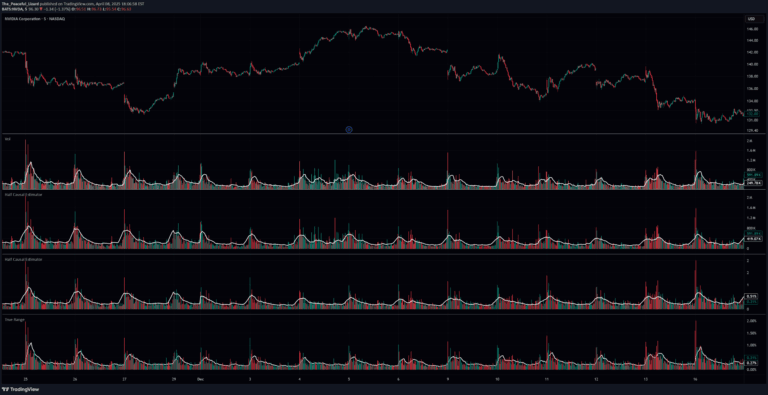
A multi-method candle prediction indicator offering various analytical approaches like linear regression, stochastics, RSI, MFI, EMA, and ARIMA modeling for comprehensive market analysis.
Explore complementary indicator rolesHow it works
This indicator employs multiple prediction methods to generate candle forecasts using different technical analysis techniques. Each method calculates potential price movements through unique mathematical models, including traditional linear regression, stochastics, RSI, money flow index, exponential moving average, and ARIMA modeling.
The various methods analyze price action from different perspectives, allowing traders to cross-reference predictions and gain a more comprehensive view of potential market movements. By offering multiple prediction techniques, the indicator provides flexibility in selecting the most appropriate analysis method for specific market conditions and trading styles.
Why it may be useful
Technical analysis requires nuanced understanding of market dynamics, and this indicator addresses that need by providing multiple predictive approaches. Traders can leverage different methodologies to confirm signals, reduce false positives, and develop more robust trading strategies across various market environments.
The multi-method approach allows traders to adapt their analysis to different market conditions, whether focusing on trend following, momentum, or pullback determination. By offering diverse prediction techniques, the indicator helps traders make more informed decisions and potentially improve their trading accuracy and risk management.
When to explore it
This indicator is most effective when traders want a comprehensive view of potential price movements across different analytical frameworks. Each method serves specific purposes: EMA 9 for trend following, stochastics for momentum analysis, RSI for pullback determination, and ARIMA for detrended range assessment.
Traders should consider using this indicator during periods of market uncertainty, when multiple confirmation signals are desired, or when seeking a more holistic approach to technical analysis. The flexibility of method selection makes it particularly useful for traders who want to develop a multi-dimensional understanding of potential price action.
Keep exploring
What we’ve verified
Access, alerts and repainting behaviour have not been independently verified for this indicator. Check the creator’s current publication and settings.
General descriptions and classifications are recovered research. Verified details above identify the specific checks we have completed. Check the creator’s current publication for later changes.