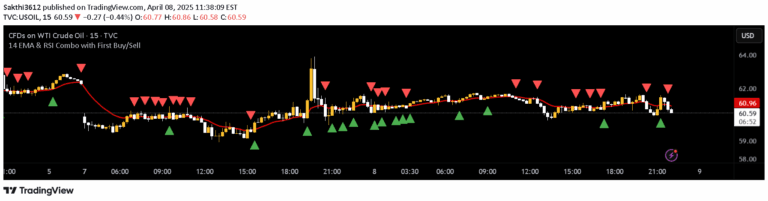
A hybrid trading indicator combining Heiken Ashi candlesticks with RSI momentum filters to provide visual insights into market trends and potential price exhaustion points.
Explore complementary indicator rolesHow it works
The indicator first transforms price data into Heiken Ashi candlesticks, which smooth out price action by calculating modified open, close, high, and low values. This smoothing helps traders identify trend structure more clearly by reducing market noise and creating more consistent candle formations.
Simultaneously, the indicator calculates the Relative Strength Index (RSI) using a specified lookback period, typically 14 periods. By comparing current price momentum against predefined overbought and oversold thresholds, the indicator dynamically colors the Heiken Ashi candles to represent different momentum states.
Why it may be useful
Traditional price charts can be challenging to interpret due to market volatility and rapid price fluctuations. By combining Heiken Ashi's trend smoothing with RSI's momentum analysis, traders gain a more comprehensive view of market dynamics in a single visual representation.
The color-coded candles provide immediate insights into potential trend strength, momentum extremes, and possible trend reversals. This integrated approach allows traders to make more informed decisions by quickly assessing both price structure and underlying momentum without switching between multiple indicators.
When to explore it
This indicator works best in markets with clear trending characteristics, such as forex, stocks, and cryptocurrencies. It is particularly effective during periods of sustained directional movement, where momentum confirmation can provide valuable trading signals.
Traders should leverage this tool during market conditions with moderate to high volatility, where quick visual trend assessment is crucial. It is especially useful for identifying potential entry and exit points, confirming trend continuations, and spotting early signs of momentum exhaustion across various timeframes.
Keep exploring
What we’ve verified
Access, alerts and repainting behaviour have not been independently verified for this indicator. Check the creator’s current publication and settings.
General descriptions and classifications are recovered research. Verified details above identify the specific checks we have completed. Check the creator’s current publication for later changes.