FTR Rules BoS/ChoCh Markup
A technical indicator that identifies Break of Structure (BoS) and Change of Character (ChoCh) to help traders recognize potential trend changes or market continuations.
Explore 11,183 indicators. Filter beyond the obvious.
Discover the tools that fit the way you trade.
11,183 tools to explore
A technical indicator that identifies Break of Structure (BoS) and Change of Character (ChoCh) to help traders recognize potential trend changes or market continuations.
Planetary Channel Lines analyze stock market trends by mapping planetary positions as support and resistance lines, using astronomical data to predict potential market turning points.
A planetary aspect oscillator that tracks the angular relationships between planets, offering unique insights into potential market influences through astrological energy measurements.
CANSLIM is an advanced stock screening strategy that evaluates companies across seven critical growth indicators to identify potentially high-performing stocks in the market.
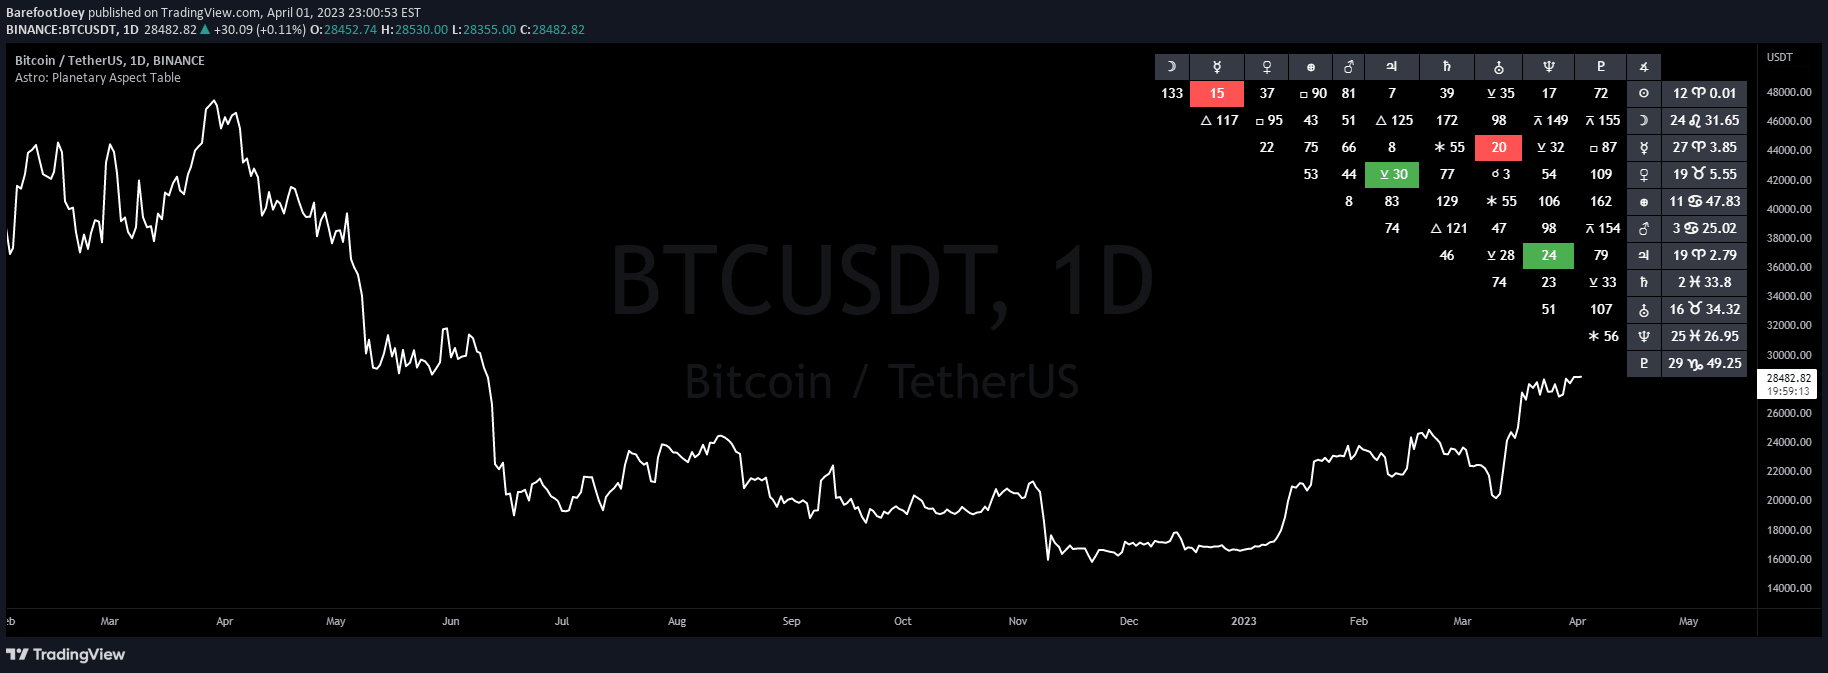
A chart overlay that highlights planetary aspects in financial markets, tracking the angular relationships between celestial bodies and their potential trading influences.
Dynamic HTF MACD Smoothing is an advanced technical indicator that smooths MACD values from higher timeframes, providing clearer and more adaptable trading signals across different chart resolutions.
A composite momentum indicator combining four key market analysis techniques to measure price movement, volume, and market sentiment in a single normalized score.
A planetary aspects chart overlay displaying real-time interplanetary angular relationships between celestial bodies, tracking their positions and potential energetic influences.
An EMA crossover strategy that generates buy and sell signals by tracking the intersection of 8-period and 50-period exponential moving averages with volatility-adjusted signal placement.
Opening range trading strategy identifies market trend and potential entry points by analyzing price movements during the first 30 minutes of trading.
EMA-Deviation-Corrected T3 is an advanced moving average that uses EMA deviation to smooth price data and generate more precise trading signals with reduced noise.
An astrological oscillator that measures planetary aspects by analyzing the angular relationships between planets, providing insights into potential market influences and energetic interactions.
Likes, views, and comments are historical TradingView snapshots. They describe attention, not trading performance.