3Commas Bot
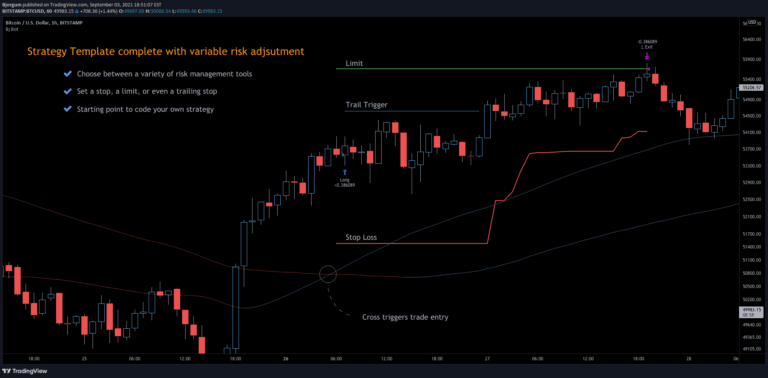
A 3Commas TradingView bot strategy offering automated trading with risk management, using moving average crossovers and customizable stop-loss and limit order settings.
Explore 11,183 indicators. Filter beyond the obvious.
Discover the tools that fit the way you trade.
11,183 tools to explore
A 3Commas TradingView bot strategy offering automated trading with risk management, using moving average crossovers and customizable stop-loss and limit order settings.
Double Tap is a pattern recognition strategy that identifies double top and double bottom formations, providing entry signals based on price action reversals and breakout patterns.
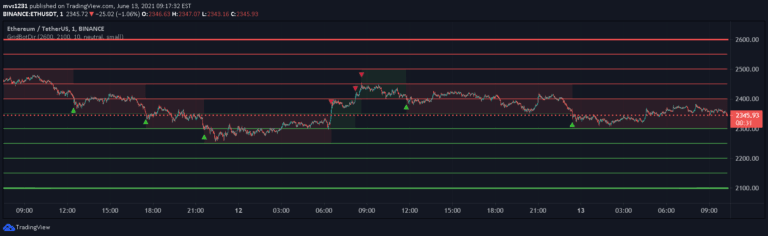
A grid trading bot simulator that divides price ranges into zones, generating trading signals based on price movement in ranging and trending markets with customizable grid settings.
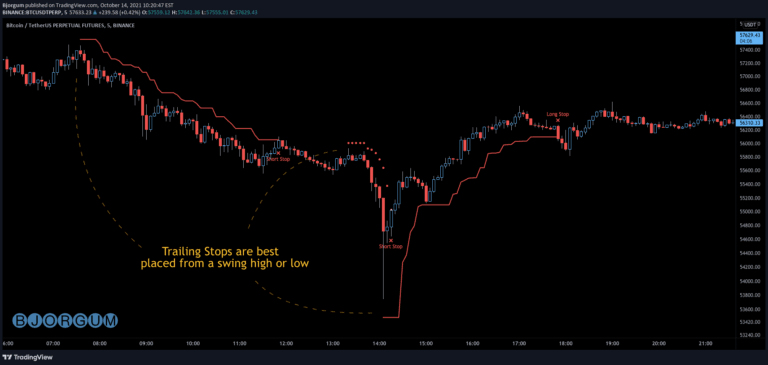
A versatile trailing stop management script for crypto and forex traders, offering multiple trail types to protect profits and manage risk dynamically during ongoing trades.
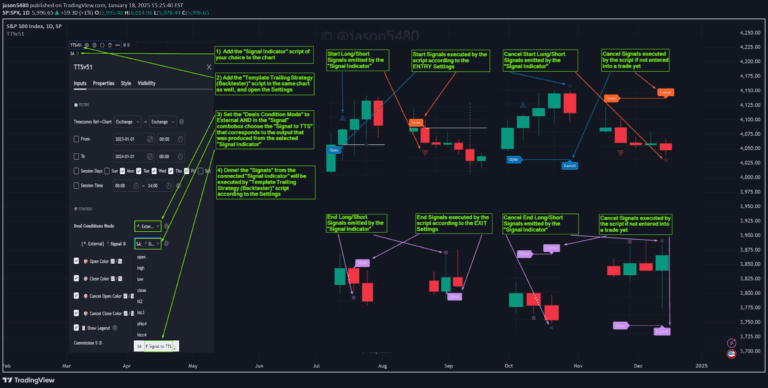
A flexible trading strategy framework enabling traders to develop, test, and evaluate custom trading logic with advanced signal management and comprehensive configuration options.
A comprehensive indicator that scans and highlights multiple reversal chart patterns like Double Tops, Cup and Handles, and Head and Shoulders using recursive zigzag analysis.
The Turtle Trade Channels Indicator (TUTCI) is a trend-following system that identifies market breakouts and captures significant price movements using Donchian Channels.
A market analysis tool that calculates probabilities of price tops and bottoms across various time periods, offering traders strategic insights into market timing and potential trend reversals.
A precise indicator that identifies double top and bottom reversal patterns in market price action, helping traders recognize potential trend changes with customizable settings and visual enhancements.
A hybrid trading indicator combining Fibonacci retracement levels and RSI to identify potential market reversals and trading opportunities based on support, resistance, and momentum signals.
Top G Indicator helps traders identify market extremes by spotting high-probability tops and bottoms using dynamic range analysis and momentum shifts.
A long-term market cycle indicator that compares short and long moving averages to identify potential market tops and bottoms, especially for assets like Bitcoin.
Likes, views, and comments are historical TradingView snapshots. They describe attention, not trading performance.