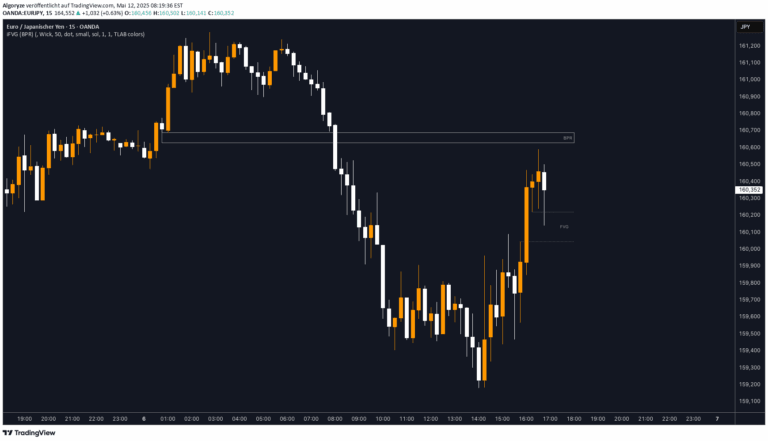
Balanced Price Range | Flux Charts
A trading indicator that identifies Balanced Price Ranges by detecting overlapping Fair Value Gaps, helping traders find potential entry points during market pullbacks.
Explore 11,183 indicators. Filter beyond the obvious.
Discover the tools that fit the way you trade.
11,183 tools to explore
A trading indicator that identifies Balanced Price Ranges by detecting overlapping Fair Value Gaps, helping traders find potential entry points during market pullbacks.
A trading tool that identifies key balanced price ranges by overlapping Fair Value Gaps to highlight potential market reversal or continuation zones.
An advanced trading indicator that identifies Fair Value Gaps (FVGs) and Inversion Zones, helping traders spot market imbalances and potential high-reaction points.
A trading indicator that identifies balanced price ranges by detecting overlapping Fair Value Gaps in opposite directions, helping traders recognize market equilibrium zones.
A flexible Fibonacci projection indicator that plots price legs and extends Fibonacci levels above or below based on user-defined lookback periods and custom extension levels.
A multi-timeframe Fair Value Gap (FVG) indicator that tracks market structure across five timeframes, helping traders identify key liquidity zones and potential price reversals.
A specialized indicator that automatically detects price imbalances and liquidity zones, helping traders identify potential retracement areas and smart money footprints in trading markets.
A dynamic trading strategy combining Fibonacci levels with the 200-period SMA to identify high-probability support and resistance zones across different market trends.
A script analyzing 14-day volatility using ATR percentage for cryptocurrencies and stocks, identifying top 5 most volatile assets and comparing them to Bitcoin's volatility.
A trading script that compares Bitcoin prices across different exchanges, calculating and visualizing price premiums and discounts between Coinbase and another selected exchange.
Likes, views, and comments are historical TradingView snapshots. They describe attention, not trading performance.