Candle Range Theory | Flux Charts
A unique trading indicator using Candle Range Theory to analyze market movements through candlestick size and structure, offering flexible entry methods with dynamic risk management.
Explore 11,183 indicators. Filter beyond the obvious.
Discover the tools that fit the way you trade.
11,183 tools to explore
A unique trading indicator using Candle Range Theory to analyze market movements through candlestick size and structure, offering flexible entry methods with dynamic risk management.
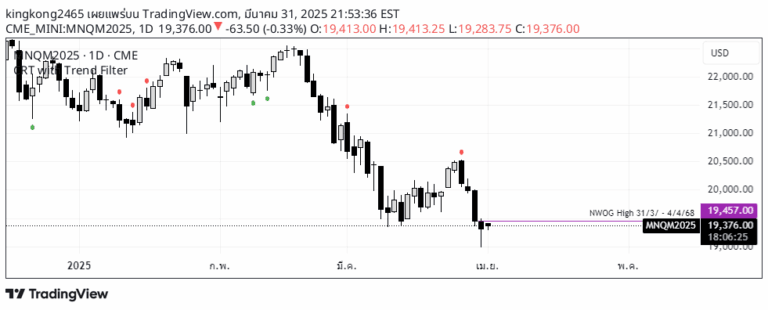
A daily technical analysis tool that detects price action patterns, marking 'Sweep and Close' scenarios to help traders identify potential market breakouts and reversals.
The CRT RED DOG indicator identifies buy and sell signals by analyzing price movements relative to a moving average, filtering signals based on market trend direction.
Likes, views, and comments are historical TradingView snapshots. They describe attention, not trading performance.