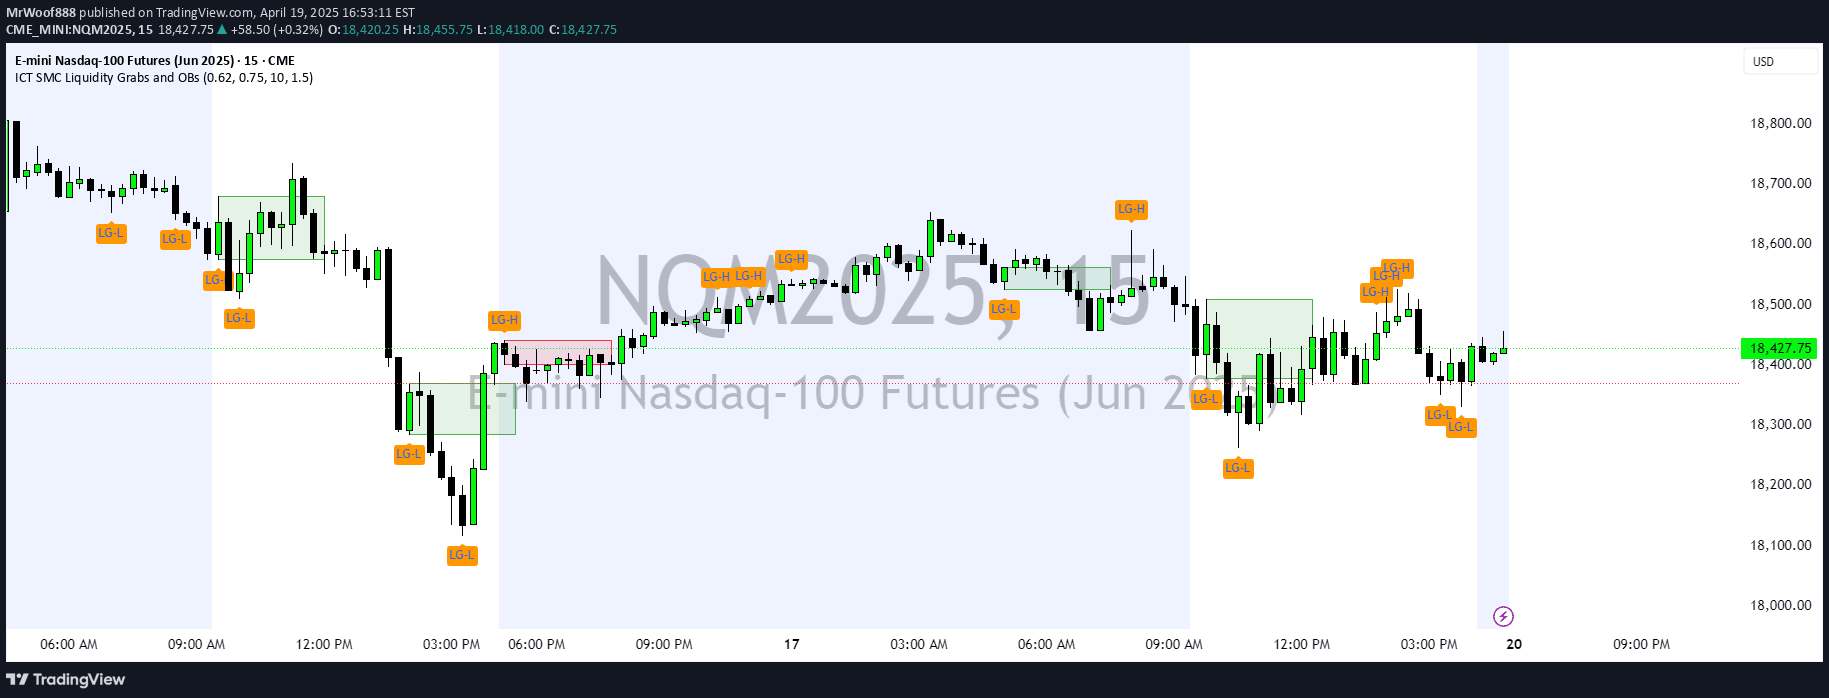
A daily technical analysis tool that detects price action patterns, marking 'Sweep and Close' scenarios to help traders identify potential market breakouts and reversals.
Explore complementary indicator rolesHow it works
The Daily CRT Indicator continuously monitors daily price action to detect specific 'Sweep and Close' patterns. It identifies two primary scenarios: sweeps above the previous day's high with an inside close, and sweeps below the previous day's low with an inside close.
When these patterns are detected, the indicator automatically draws horizontal lines at the previous day's high and low levels. These lines serve as visual reference points for key support and resistance zones, helping traders quickly recognize potential trading opportunities.
Why it may be useful
The Daily CRT Indicator provides traders with a sophisticated tool for identifying nuanced price action patterns that might signal significant market movements. By highlighting specific sweep and close scenarios, the indicator helps traders recognize potential trend reversals or continuations before they become obvious to the broader market.
Moreover, the indicator's customizable features like color-coded lines, alert systems, and historical pattern display enhance a trader's ability to make informed decisions. Its focused approach on daily timeframe patterns makes it particularly valuable for traders seeking to capture meaningful market shifts.
When to explore it
The Daily CRT Indicator is most effective for swing traders who focus on capturing multi-day price movements and are interested in sophisticated price action analysis. It works best in markets with clear directional trends and when traders want to identify potential breakout or reversal points with greater precision.
Traders should primarily use this indicator on daily charts and during periods of moderate to high market volatility. It is particularly useful for identifying potential entry and exit points in trending markets, where sweep and close patterns can provide early signals of significant price action.
Keep exploring
What we’ve verified
Access, alerts and repainting behaviour have not been independently verified for this indicator. Check the creator’s current publication and settings.
General descriptions and classifications are recovered research. Verified details above identify the specific checks we have completed. Check the creator’s current publication for later changes.