YOUR INDICATOR RESEARCH STARTS HERE

Find the right indicator.
Understand what it does.

Explore 11,183 indicators. Filter beyond the obvious.
Discover the tools that fit the way you trade.

THE INDICATOR LIBRARY

Results for “candlerangetheory”

11,183 tools to explore

3 indicators matching your filters
Save search
SignalTrendVolatility

Candle Range Theory | Flux Charts

by fluxchart

A unique trading indicator using Candle Range Theory to analyze market movements through candlestick size and structure, offering flexible entry methods with dynamic risk management.

Main price chart · unverifiedScalping · Day Trading
Explore
2.5Klikes48.2Kviews14comments
Save
PatternsSignal

Daily CRT

by TraderSenseii

A daily technical analysis tool that detects price action patterns, marking 'Sweep and Close' scenarios to help traders identify potential market breakouts and reversals.

Main price chart · unverifiedSwing Trading
Explore
430likes10.8Kviews2comments
Save
TrendMomentum

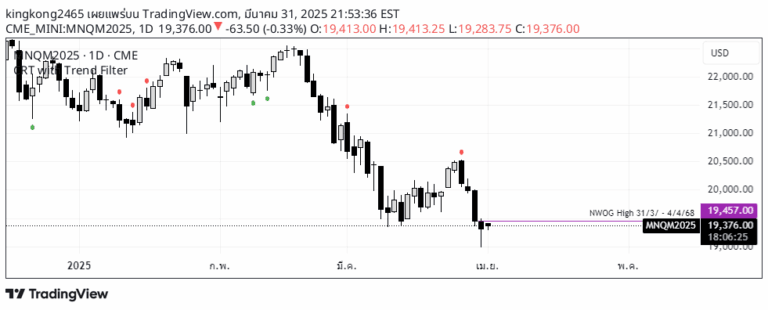
CRT with Trend Filter

by kingkong2465

The CRT RED DOG indicator identifies buy and sell signals by analyzing price movements relative to a moving average, filtering signals based on market trend direction.

Main price chart · unverifiedDay Trading
Explore
68likes2.2Kviews0comments
Save

Likes, views, and comments are historical TradingView snapshots. They describe attention, not trading performance.

START WITH A QUESTION

A little less searching.
A lot more understanding.

Tell DeepAlpha what you need. Get an explanation, a shortlist,
and a direct path to the indicators behind it.

Ask DeepAlpha