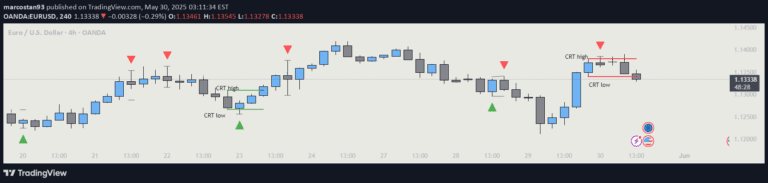
Candle Range Theory | Flux Charts
A unique trading indicator using Candle Range Theory to analyze market movements through candlestick size and structure, offering flexible entry methods with dynamic risk management.
Explore 11,183 indicators. Filter beyond the obvious.
Discover the tools that fit the way you trade.
11,183 tools to explore
A unique trading indicator using Candle Range Theory to analyze market movements through candlestick size and structure, offering flexible entry methods with dynamic risk management.
A custom indicator that identifies strong momentum candles by comparing candlestick body size to its wicks, highlighting potential trend continuation or reversal points.
A power cycle indicator identifying potential market manipulations or reversals by tracking candle sweeps and range closures, designed to highlight strategic entry points.
A sophisticated trading model using three-candle structures to analyze price action and identify high-probability trade setups across futures and forex markets.
Range Separator is a visual trading tool that helps traders identify critical price levels and ranges by marking hourly and 15-minute intervals with customizable lines.
A 4-hour candle strategy that identifies key trading levels by marking 1am and 4am candle ranges, helping traders find high-probability entry points across volatile markets.
A trading strategy focusing on specific time frames and market sessions to identify high-probability entry points using CRT candles and session-based volatility analysis.
A custom trading indicator that calculates session high, low, and equilibrium levels using Candle Range Theory to identify potential market movements and trading opportunities.
A trading indicator that identifies potential market reversals or continuations by analyzing two consecutive candle patterns and generating visual signals with triangular markers.
A multi-timeframe candle range analysis tool that visualizes market structure by plotting candle ranges across different timeframes and detecting potential trading opportunities.
A daily technical analysis tool that detects price action patterns, marking 'Sweep and Close' scenarios to help traders identify potential market breakouts and reversals.
A powerful multi-timeframe liquidity grab indicator that identifies potential market reversals by detecting precise price sweeps and providing confluence across different timeframes.
Likes, views, and comments are historical TradingView snapshots. They describe attention, not trading performance.