Drip's 11am rule breakout/breakdown (OG)
A trading strategy focusing on identifying potential price continuation after 11:30 AM EST, using high/low of day zones and momentum indicators to signal trading opportunities.
Explore 11,183 indicators. Filter beyond the obvious.
Discover the tools that fit the way you trade.
11,183 tools to explore
A trading strategy focusing on identifying potential price continuation after 11:30 AM EST, using high/low of day zones and momentum indicators to signal trading opportunities.
A normal distribution curve overlay that visually maps the probability of price movements, helping traders identify outliers, potential support/resistance zones, and market inefficiencies across different assets and timeframes.
Measures futures market leverage by comparing open interest to market capitalization, revealing potential deleveraging risks and market dynamics.
A comprehensive altcoin market analysis tool tracking 40 cryptocurrencies across different categories, providing insights into market trends and performance across various blockchain layers.
A script for drawing support and resistance regions based on ATM strike prices in options trading, helping traders identify key price levels dynamically.
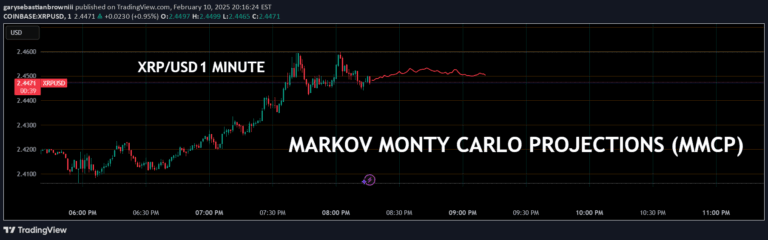
A probabilistic forecasting tool using Markov Chains and Monte Carlo simulations to generate potential future price paths by analyzing historical price movement probabilities and volatility.
A trading signal that identifies consecutive inside bars by referencing the most recent non-inside bar, highlighting unique price action patterns without extensive historical tracking.
A trading signal script for SPX500 that identifies price movements by comparing current and previous bar closes, helping traders detect market energy flow and potential trading opportunities.
A comprehensive index tracking commodity futures across multiple sectors including agricultural, energy, metals, and livestock markets, providing insights into global commodity performance.
A VIX-based trading signal that identifies potential market drop opportunities by tracking volatility spikes and price action across multiple timeframes and conditions.
Likes, views, and comments are historical TradingView snapshots. They describe attention, not trading performance.