YOUR INDICATOR RESEARCH STARTS HERE

Find the right indicator.
Understand what it does.

Explore 11,183 indicators. Filter beyond the obvious.
Discover the tools that fit the way you trade.

THE INDICATOR LIBRARY

Results for “clusters”

11,183 tools to explore

62 indicators matching your filters
Save search
TrendEditor’s pick

SuperTrend AI (Clustering) [LuxAlgo]

by LuxAlgo

SuperTrend AI is an advanced machine learning technique that applies K-means clustering to the SuperTrend indicator, dynamically adapting trailing stop settings based on performance metrics.

Main price chart · unverifiedDay Trading · Swing Trading
Explore
17.8Klikes586.2Kviews155comments
Save
VolumeTrendLevelsEditor’s pick

Liquidity Price Depth Chart [LuxAlgo]

by LuxAlgo

A depth chart visualizing price liquidity by mapping bullish and bearish price variations, highlighting volume clusters and potential support/resistance zones across trading ranges.

Separate pane · unverifiedScalping · Day Trading
Explore
6.6Klikes276.8Kviews14comments
Save
VolumeTrendEditor’s pick

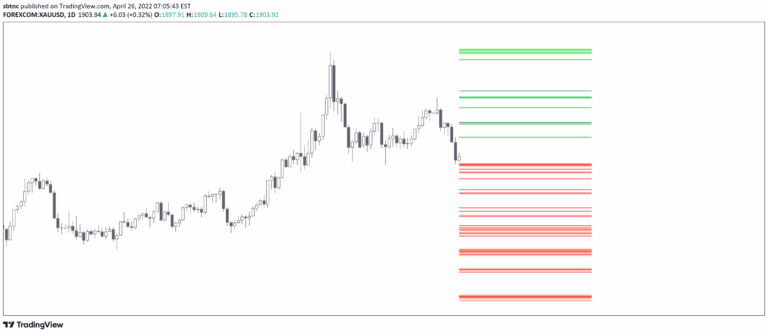
HTF Liquidity Levels

by sbtnc

A trading indicator that identifies untapped liquidity levels across different timeframes, helping traders understand potential price movement magnets and liquidity pools in the market.

Main price chart · unverifiedDay Trading · Swing Trading
Explore
4Klikes177.3Kviews83comments
Save
LevelsVolatilityVolume

Liquidation Levels [LuxAlgo]

by LuxAlgo

A signal that identifies potential liquidation price levels where highly leveraged traders' positions may be forcibly closed, revealing key market support and resistance zones.

Main price chart · unverifiedScalping · Day Trading
Explore
4Klikes105.3Kviews18comments
Save
ChannelsSignalTrend

AI Channels (Clustering) [LuxAlgo]

by LuxAlgo

AI Channels indicator uses K-means clustering to identify trend directions and potential price breakouts by analyzing price clusters and their centroids dynamically.

Main price chart · unverifiedScalping · Day Trading
Explore
2.7Klikes109.6Kviews16comments
Save
LevelsSignalVolume

Liqudation HeatMap [BigBeluga]

by BigBeluga

A dynamic heatmap tool that identifies potential liquidity zones by analyzing historical price movements and volume concentration, revealing hidden market dynamics.

Main price chart · unverifiedScalping · Day Trading
Explore
2.1Klikes23.9Kviews12comments
Save

Likes, views, and comments are historical TradingView snapshots. They describe attention, not trading performance.

START WITH A QUESTION

A little less searching.
A lot more understanding.

Tell DeepAlpha what you need. Get an explanation, a shortlist,
and a direct path to the indicators behind it.

Ask DeepAlpha