Ichimoku
Ichimoku Kinko Hyo is a comprehensive technical indicator that provides insights into trend direction, momentum, and potential support and resistance levels using multiple components.
Explore 11,183 indicators. Filter beyond the obvious.
Discover the tools that fit the way you trade.
11,183 tools to explore
Ichimoku Kinko Hyo is a comprehensive technical indicator that provides insights into trend direction, momentum, and potential support and resistance levels using multiple components.
ICT Killzones Toolkit is a comprehensive trading analysis system that identifies key market zones, patterns, and institutional trading levels using multiple price action components.
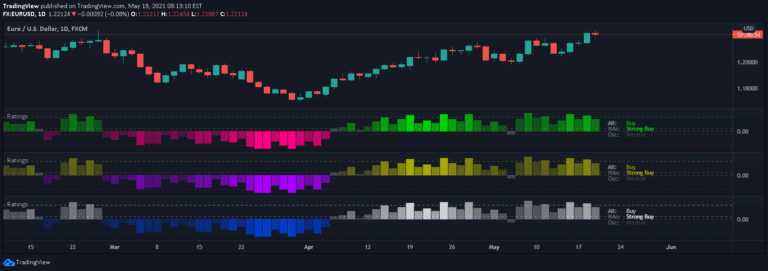
A comprehensive trading signal that aggregates 26 technical indicators into a single rating, evaluating market sentiment through moving averages and oscillators to provide actionable trading insights.
A comprehensive trading toolkit that identifies critical market zones, institutional liquidity levels, and potential price movement patterns using advanced technical analysis techniques.
A volume profile indicator that reveals trading activity at price levels, highlighting key support and resistance zones through volume analysis and detecting market liquidity dynamics.
A sophisticated market structure indicator that identifies key price action components like Change of Characters, Inducements, and Liquidity Sweeps to help traders analyze market movements.
A comprehensive trading framework designed to help traders develop, analyze, and manage trading strategies with advanced risk and reward tracking capabilities across multiple market conditions.
An advanced Ichimoku Kinko Hyo indicator with extensive customization options for analyzing market trends, momentum, and potential trading signals across different timeframes.
Ichimoku Oscillator is a multi-layered technical analysis tool that evaluates market trends using Ichimoku Cloud features, providing insights into potential entry and exit points.
A comprehensive Ichimoku trading tool that combines multiple theories to analyze market trends, cycles, waves, and potential price targets using advanced Japanese technical analysis techniques.
A comprehensive trading toolkit combining RSI divergences, correction zones, and advanced support/resistance levels to help traders analyze market movements and potential trend reversals.
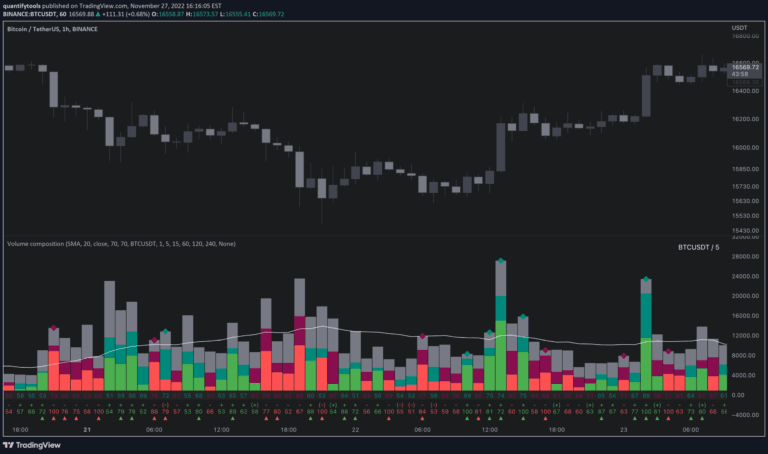
Volume composition indicator that breaks down trading volume into buy, sell, passive, and active components to provide deeper insights into market liquidity and potential price movements.
Likes, views, and comments are historical TradingView snapshots. They describe attention, not trading performance.