Machine Learning Adaptive SuperTrend [AlgoAlpha]
A machine learning-powered SuperTrend indicator that uses k-means clustering to dynamically adapt to market volatility, providing intelligent trend identification and volatility insights.
Explore 11,183 indicators. Filter beyond the obvious.
Discover the tools that fit the way you trade.
11,183 tools to explore
A machine learning-powered SuperTrend indicator that uses k-means clustering to dynamically adapt to market volatility, providing intelligent trend identification and volatility insights.
A custom indicator using linear regression to analyze closing prices, helping traders identify market trends, mean reversion, and potential overbought or oversold conditions across different timeframes.
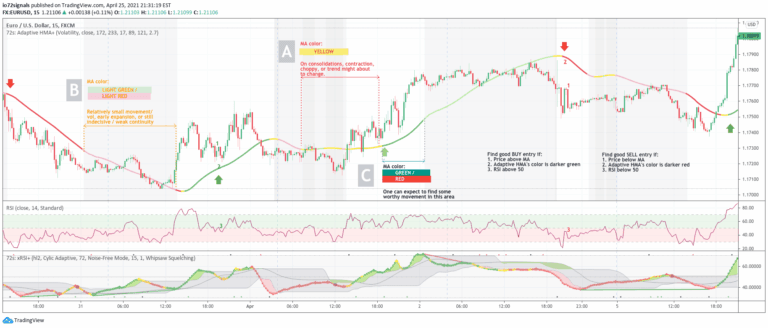
An adaptive Hull Moving Average that dynamically adjusts its period based on volume and volatility, providing clearer trend signals and market condition insights for traders.
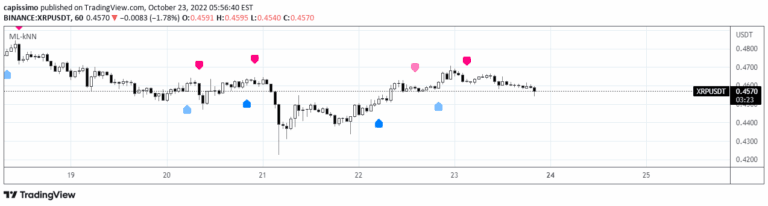
A k-Nearest Neighbours machine learning strategy that predicts market moves by analyzing historic data and finding similar past market conditions to forecast future price directions.
A trailing stop strategy that uses market structure like Change of Character (CHoCH) and Break of Structure (BOS) to dynamically adjust stop-loss levels for protecting profits.
A derivative RSI indicator using a Moving Average with a trailing stop level that generates buy and sell signals based on crossovers and market conditions.
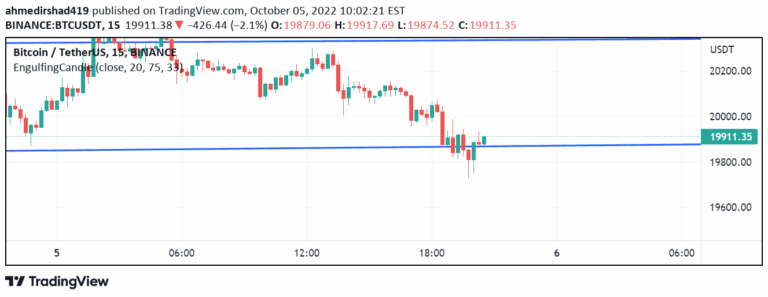
A trading signal combining RSI momentum indicator with candlestick engulfing patterns to identify potential trend reversals and generate buy or sell signals based on overbought and oversold conditions.
A trading signal that predicts potential choppiness in New York trading sessions by analyzing price behavior during Asian and London sessions, with customizable success tracking.
A sophisticated logistic regression indicator that identifies and predicts support and resistance levels using advanced statistical modeling and market condition analysis.
Advanced trading indicator that detects potential market reversals using price action analysis, volume confirmation, and a dynamic moving average to identify trend shifts and trading opportunities.
RSI Momentum Trend is an advanced trading indicator that identifies market momentum by analyzing Relative Strength Index values and calculating dynamic trend conditions.
A comprehensive trend and strength indicator that uses moving averages and standard deviation to identify market trends, providing color-coded signals and a dynamic strength gauge for traders.
Likes, views, and comments are historical TradingView snapshots. They describe attention, not trading performance.