
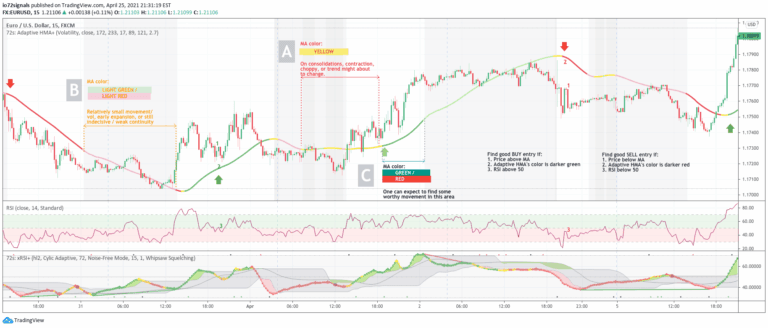
72s: Adaptive Hull Moving Average+
An adaptive Hull Moving Average that dynamically adjusts its period based on volume and volatility, providing clearer trend signals and market condition insights for traders.
Explore 11,183 indicators. Filter beyond the obvious.
Discover the tools that fit the way you trade.
11,183 tools to explore
An adaptive Hull Moving Average that dynamically adjusts its period based on volume and volatility, providing clearer trend signals and market condition insights for traders.
A multi-timeframe supply and demand indicator that identifies trading zones based on momentum candles, helping traders recognize potential support and resistance levels.
An advanced Open Interest indicator that provides comprehensive market insights through multiple visualization techniques and real-time statistical analysis of trading positions.
A trading indicator that identifies market structure shifts and breakout opportunities using smart money concepts like Break of Structure and Change of Character.
A technical analysis tool combining MACD and RSI overlaid on price charts, offering traders insights into market momentum, trend direction, and potential trade signals.
A market structure analysis technique that identifies trend changes and pivotal points using Break of Structure (BOS) and Change of Character (CHOCH) concepts.
Multi-timeframe market formation tool that analyzes up to 6 different timeframes simultaneously, revealing market structure, support/resistance levels, and synchronization across time periods.
A multi-level trend classification tool that detects market momentum using adaptive smoothing, color-coded candles, and dynamic trend bands to help traders identify trend strength and potential reversals.
A real-time volume indicator analyzing bull and bear activity across 20 symbols, displaying green and red bars to represent trading volume dynamics and market sentiment.
An AI-powered SuperTrend clustering oscillator that identifies market trends by analyzing multiple SuperTrend indicators through k-means clustering, providing bullish, bearish, and consensus outputs.
RSI-Divergence Goggle is an innovative trading indicator that plots RSI directly on the price chart, enabling comprehensive divergence analysis with interactive features.
A comprehensive trading system using machine-engineered signals combining RSI, SuperTrend, and adaptive candle coloring for precise market entry and trend detection.
Likes, views, and comments are historical TradingView snapshots. They describe attention, not trading performance.