Candle Range Trading (CRT) with Alerts
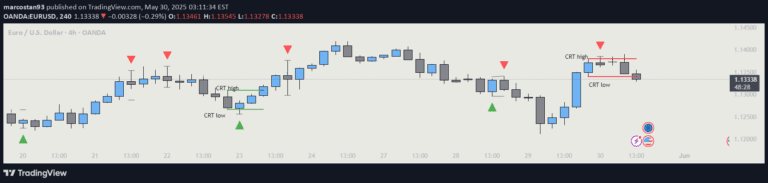
A trading indicator that identifies potential market reversals or continuations by analyzing two consecutive candle patterns and generating visual signals with triangular markers.
Explore 11,183 indicators. Filter beyond the obvious.
Discover the tools that fit the way you trade.
11,183 tools to explore
A trading indicator that identifies potential market reversals or continuations by analyzing two consecutive candle patterns and generating visual signals with triangular markers.
A regression channel indicator that helps traders identify price trends across multiple timeframes by calculating regression lines and channel boundaries for different trading perspectives.
Advanced Momentum Indicator (AMI) measures market momentum by comparing actual volume and candle size to their moving averages, revealing strength and direction of price movements.
Global Leaders M2 Indicator tracks money supply data for top 10 economic countries, providing insights into monetary trends and economic performance across global markets.
A trading tool that identifies market conditions by analyzing ADX, RSI, and Bollinger Bands to distinguish between sideways markets and strong trend environments.
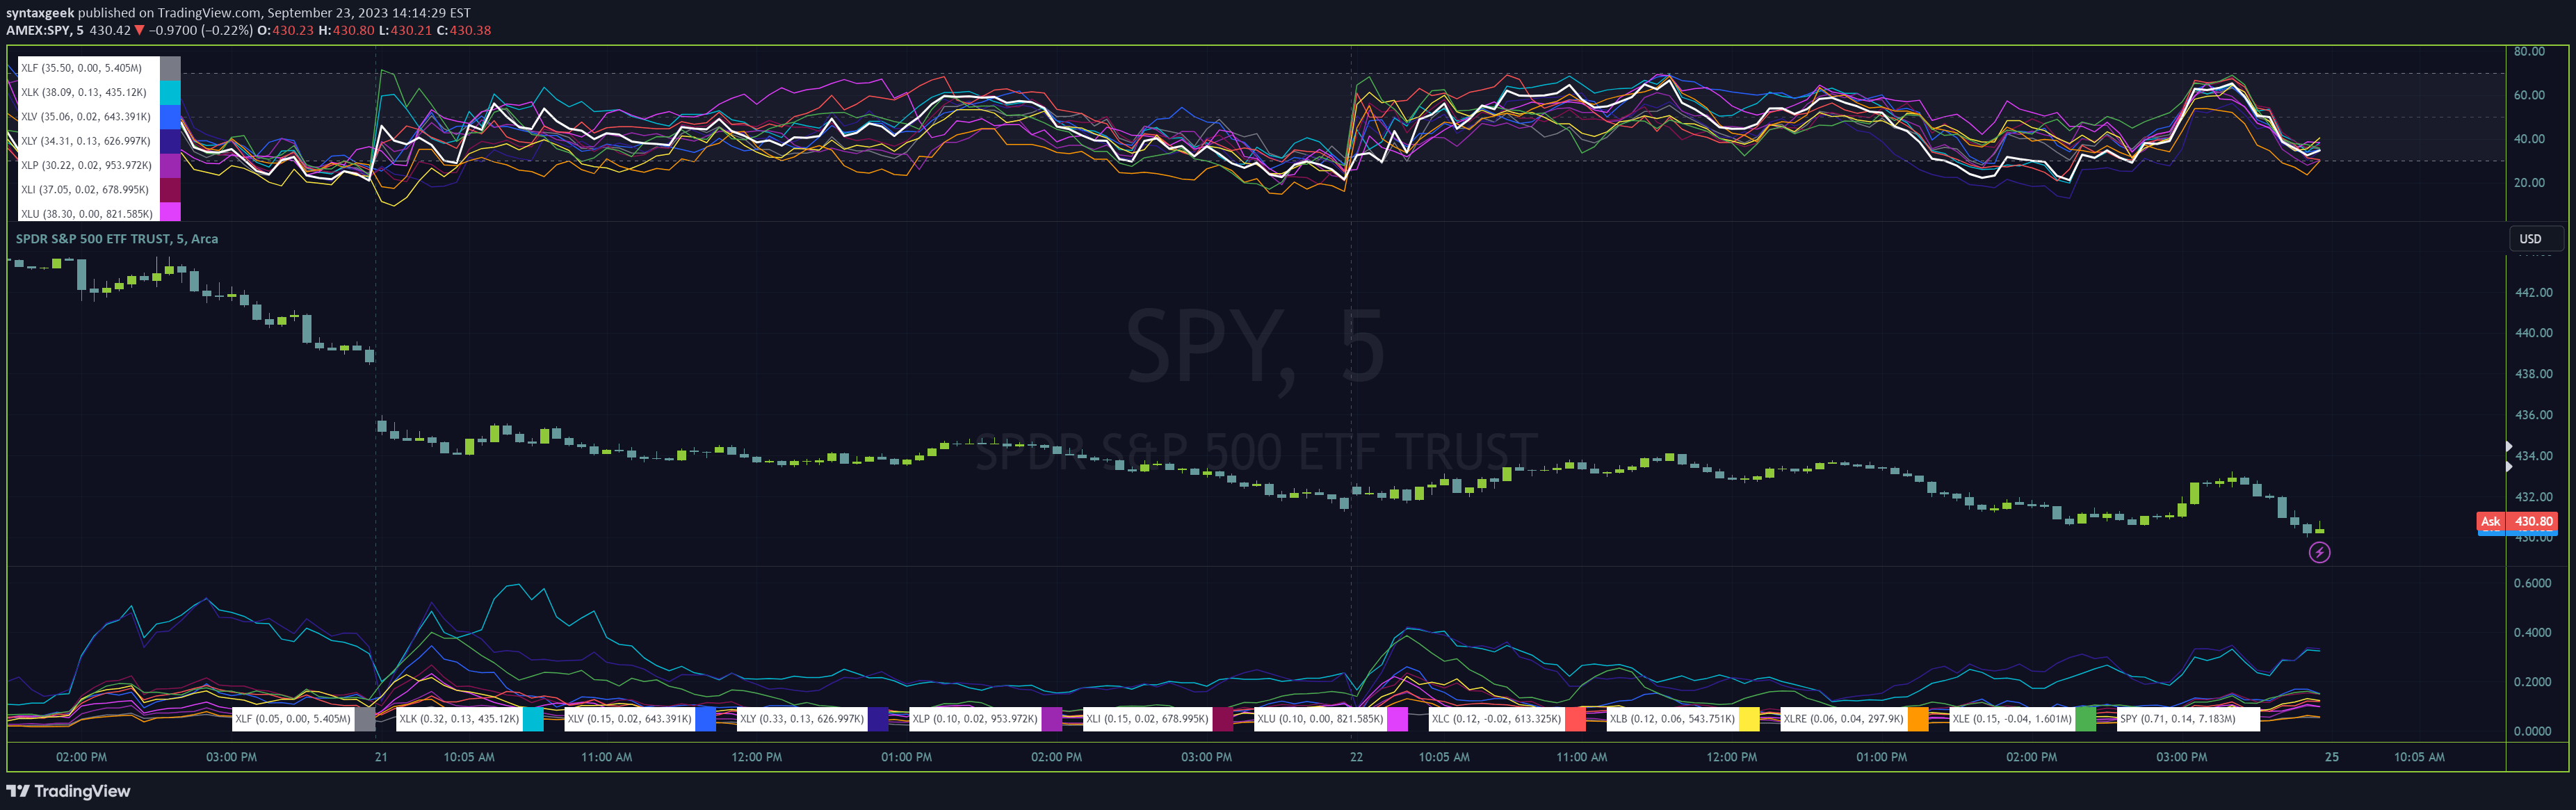
A comprehensive indicator tracking SPDR Index Funds to monitor sector performance, helping traders identify trend directions and potential investment opportunities across different market segments.
A TradingView script that visually highlights monthly zones on charts using distinct, high-contrast colors with 90% transparency for easier monthly identification.
Likes, views, and comments are historical TradingView snapshots. They describe attention, not trading performance.