Multi Kernel Regression [ChartPrime]
A versatile trading indicator using kernel regression to smooth price data and reveal market trends through customizable regression lines and kernel types.
Explore 11,183 indicators. Filter beyond the obvious.
Discover the tools that fit the way you trade.
11,183 tools to explore
A versatile trading indicator using kernel regression to smooth price data and reveal market trends through customizable regression lines and kernel types.
A trading signal that finds the most similar historical price sequences and projects future price movements using multiple similarity and correlation measures.
Advanced machine learning trading strategy utilizing signal processing techniques and custom moving averages to generate precise housing market trading signals and performance metrics.
Cosine Kernel Regressions use advanced mathematical techniques to analyze market trends, providing smoothed insights into price movements through multi-indicator kernel regression.
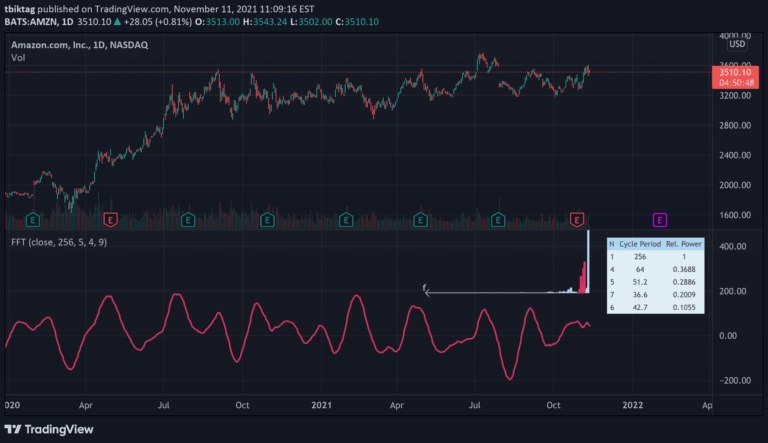
A Fast Fourier Transform (FFT) algorithm that decomposes time series data into cyclical frequency components, enabling advanced time series filtering and analysis.
A bandpass filter indicator analyzing price motion through 11 spectral filters, enabling traders to predict future price highs and lows using cyclic price components.
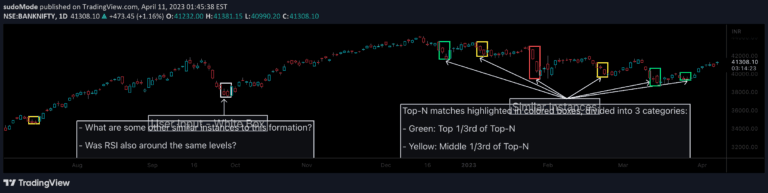
A pattern recognition tool that analyzes price chart similarities by computing vector-based similarities across multiple candle dimensions, highlighting potential matching historical patterns.
A unique volatility indicator using cosine-weighted moving average and ATR to generate trading signals by analyzing price movements with enhanced smoothing and weighting techniques.
TrigWave Suite combines multiple advanced moving averages and analysis techniques to generate comprehensive trading signals using hyperbolic, sine, and cosine-weighted calculations.
A two-step linear regression model analyzing Bitcoin's exchange rate dynamics through momentum, halving events, and market cycles to understand price movements.
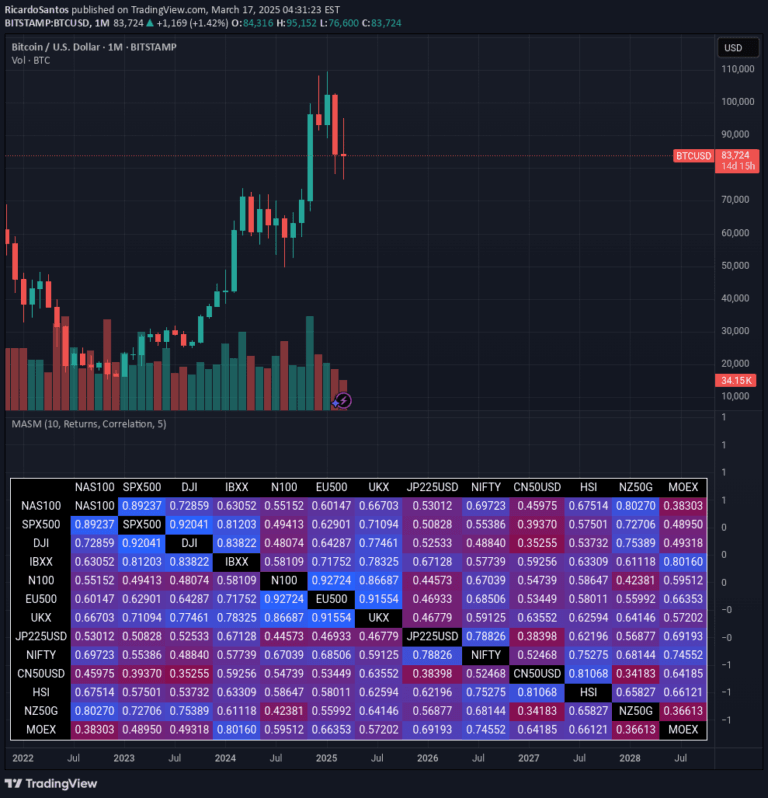
A market analysis tool that calculates and visualizes asset similarities using advanced mathematical measures, revealing complex relationships between different market indices through color-coded correlation metrics.
Advanced technical indicator using Goertzel algorithm to detect and analyze dominant market cycles, helping traders identify underlying price movement patterns and potential trading opportunities.
Likes, views, and comments are historical TradingView snapshots. They describe attention, not trading performance.