
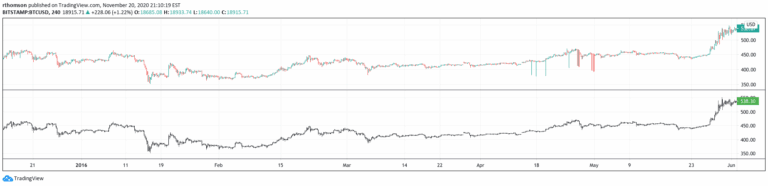
Aggregate BTC Candles
A trading signal that creates price candles using a median aggregated Bitcoin index from multiple exchanges, aiming to minimize data inconsistencies and provide more reliable price history.
Explore 11,183 indicators. Filter beyond the obvious.
Discover the tools that fit the way you trade.
11,183 tools to explore
A trading signal that creates price candles using a median aggregated Bitcoin index from multiple exchanges, aiming to minimize data inconsistencies and provide more reliable price history.
A trading signal that detects price crashes using multiple Bollinger Bands with increasing standard deviation multipliers, identifying potential buying opportunities during high volatility.
A logarithmic volume indicator that calculates delta between buying and selling volume to reveal market pressure and potential flash crash conditions.
A signal that tracks stablecoin price deviations from their $1 peg, identifying potential market shifts and trading opportunities based on USDT, USDC, and FDUSD movements.
A multi-timeframe divergence radar that monitors MACD and DMI indicators to detect potential counter-trend trading opportunities across 1m, 3m, and 5m charts.
A flexible trading tool for analyzing price ranges and market behavior, enabling traders to count bars inside and outside specified price and date ranges.
A comprehensive tool that allows traders to explore Bitcoin's entire price history, highlighting major events and providing contextual markers for understanding cryptocurrency market evolution.
A flexible chart annotation tool allowing traders to manually highlight and visualize specific market periods, economic events, and historical market crashes directly on trading charts.
A historical analysis of economic downturns highlighting significant recession periods across various decades in the United States financial markets.
Likes, views, and comments are historical TradingView snapshots. They describe attention, not trading performance.