YOUR INDICATOR RESEARCH STARTS HERE

Find the right indicator.
Understand what it does.

Explore 11,183 indicators. Filter beyond the obvious.
Discover the tools that fit the way you trade.

THE INDICATOR LIBRARY

Results for “division”

11,183 tools to explore

20 indicators matching your filters
Save search
SignalLevels

Clone Pivots. Oct_2023

by JohnBaron

A trading indicator that divides price charts by pivots using either halving method or Fibonacci divisions, creating strategic reference points for potential trading opportunities.

Main price chart · unverifiedScalping · Day Trading
Explore
182likes4.7Kviews0comments
Save
SignalLevels

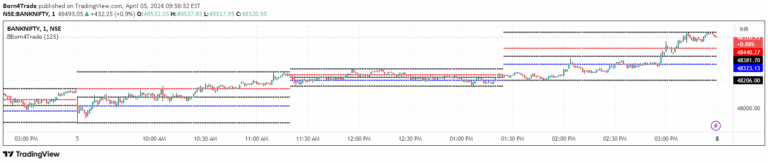
Born4Trade

by Born4Trade

Born4Trade analyzes intraday price ranges by dividing high and low points into segments, creating strategic trading reference points for market entry and exit.

Main price chart · unverifiedScalping · Day Trading
Explore
112likes2.2Kviews2comments
Save
MomentumOscillatorTrend

Whaley Breadth Thrust Indicator

by Mysterysauce

The Whaley Breadth Thrust Indicator measures market momentum by comparing advancing to declining stocks, providing insights into market trend strength and potential direction.

Separate pane · unverifiedDay Trading · Swing Trading
Explore
97likes2.4Kviews1comments
Save
LevelsTrend

Gold Value Rainbow

by danny_peanuts

A unique indicator for Gold valuation using base money supply from major global economies to assess whether Gold is overvalued or undervalued relative to market conditions.

Main price chart · unverifiedSwing Trading
Explore
78likes4.7Kviews1comments
Save
MomentumSignalOscillator

Price OI Division

by discountry

Price OI Division Indicator analyzes price momentum and open interest relationship using a modified MACD approach. It provides visual insights into market positioning and potential trend changes.

Separate pane · unverifiedScalping · Day Trading
Explore
49likes1Kviews0comments
Save
Signal

PI indicator

by spiritedtez

A systematic method of calculating trading lines using the first 5-minute candle range, π value, and sequential mathematical transformations to create strategic price reference points.

Main price chart · unverifiedScalping · Day Trading
Explore
47likes1.7Kviews0comments
Save
OscillatorSignal

Composite Cosmetic Candles

by EsIstTurnt

A customizable visual indicator for trading charts that allows multiple oscillator sources, dividing lines, and candle fill options to enhance chart readability and trading insights.

Separate pane · unverifiedScalping · Day Trading
Explore
37likes2.3Kviews4comments
Save
LevelsTrend

Index Value Rainbow

by danny_peanuts

An advanced index valuation tool that compares market index performance against base money supply using a rainbow of multiplication and division factors.

Main price chart · unverifiedSwing Trading
Explore
27likes1.4Kviews0comments
Save
SignalTrend

AT Ratio

by ATGA2021

AT Ratio is a comparative indicator that plots the ratio between two financial symbols to assess relative performance and strength of assets over time.

Main price chart · unverifiedDay Trading · Swing Trading
Explore
17likes518views0comments
Save
MomentumSignalTrend

S&P 500 Top 25 - EPS Analysis

by EdgeTools

Advanced earnings analysis framework tracking S&P 500 top 25 stocks' earnings surprises, calculating actual and estimated EPS to identify potential market-moving events.

Separate pane · unverifiedDay Trading · Swing Trading
Explore
17likes379views0comments
Save

Likes, views, and comments are historical TradingView snapshots. They describe attention, not trading performance.

START WITH A QUESTION

A little less searching.
A lot more understanding.

Tell DeepAlpha what you need. Get an explanation, a shortlist,
and a direct path to the indicators behind it.

Ask DeepAlpha