Gaps + Imbalances + Wicks (MTF) - By Leviathan
A comprehensive trading signal that identifies and visualizes price gaps, wicks, and market imbalances across multiple timeframes with advanced customization options.
Explore 11,183 indicators. Filter beyond the obvious.
Discover the tools that fit the way you trade.
11,183 tools to explore
A comprehensive trading signal that identifies and visualizes price gaps, wicks, and market imbalances across multiple timeframes with advanced customization options.
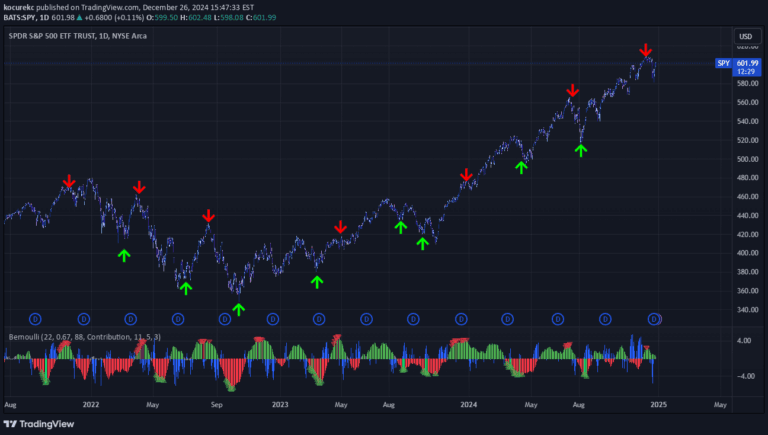
A binary entropy function using price and volume to measure information content and generate trading signals based on statistical measurement of market movements and potential trend shifts.
A trading technique identifying Fair Value Gaps and their inversions to detect potential momentum shifts and price movement reversals in market trends.
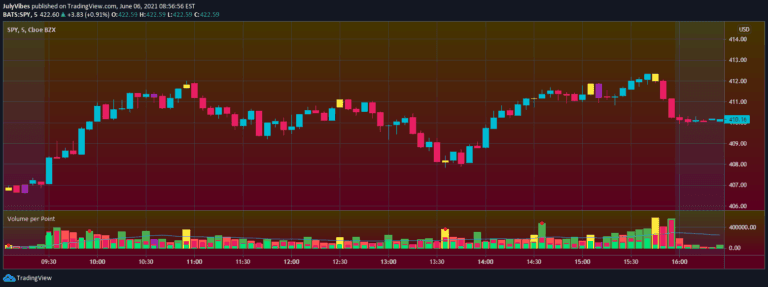
Volume per Point (VP) indicator tracks volume efficiency by analyzing volume relative to price movement, revealing market maker activity and potential trading opportunities through color-coded signals.
The Adaptive Moving Average (AMA) Signals indicator dynamically adjusts to market volatility, providing responsive trend identification and trading signals by measuring market efficiency and price directionality.
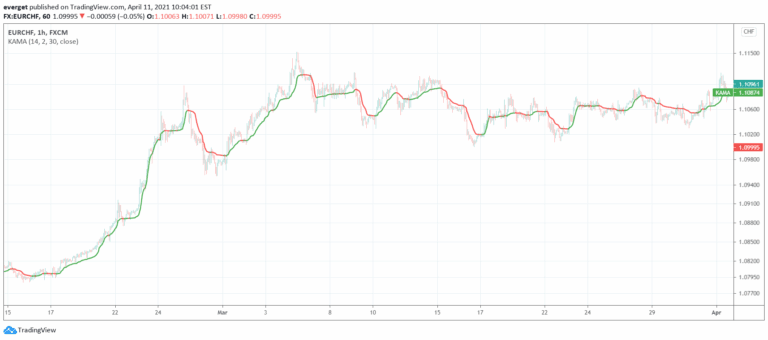
Kaufman Adaptive Moving Average is a dynamic indicator that adjusts its sensitivity based on market conditions, helping traders identify trend direction and momentum with improved responsiveness.
The Anchored Powered KAMA is an advanced adaptive moving average that uses multiple anchor periods and a power exponent to filter market trends and volatility more effectively.
Efficient Work measures price movement efficiency by comparing price travel distance to actual price change, providing insights into market sentiment and price movement strength.
An advanced orderflow indicator that calculates price movement efficiency using volume-weighted analysis, providing insights into market trends and potential reversals with customizable parameters.
A risk-adjusted returns indicator for Bitcoin that evaluates asset valuation through a Sharpe Ratio calculation over 180 days, providing color-coded insights into market conditions.
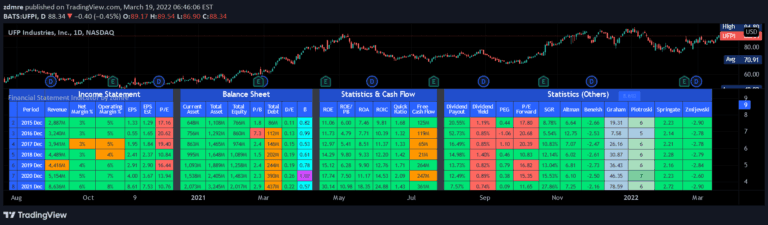
A comprehensive financial analysis tool that combines key financial statement metrics to assess a company's financial health, performance, and investment potential across income, balance sheet, and cash flow dimensions.
A comprehensive financial health assessment that evaluates a company's debt management, liquidity, and profitability through multiple key financial metrics and risk indicators.
Likes, views, and comments are historical TradingView snapshots. They describe attention, not trading performance.