Gradient Range [BigBeluga]
A dynamic range detection indicator that uses ADX and gradient candlesticks to identify market conditions, range boundaries, and potential mean reversion points.
Explore 11,183 indicators. Filter beyond the obvious.
Discover the tools that fit the way you trade.
11,183 tools to explore
A dynamic range detection indicator that uses ADX and gradient candlesticks to identify market conditions, range boundaries, and potential mean reversion points.
A sophisticated statistical arbitrage tool that uses advanced mathematical techniques to detect potential market reversals by analyzing EMA relationships and statistical spread dynamics.
MAZ is a dynamic moving average indicator that creates support and resistance zones, helping traders identify potential trend reversals and key price interaction points.
A comprehensive $TICK indicator that provides traders with real-time market sentiment analysis through color-coded trend gauges, extreme readings, and cumulative tick visualization.
A technical analysis tool that identifies price inefficiencies by detecting Fair Value Gaps, highlighting areas with little to no traded volume using color-coded boxes on the chart.
A unique volume-based indicator that dynamically adjusts candle transparency to highlight market activity, making high-volume candles more prominent while low-volume candles fade into the background.
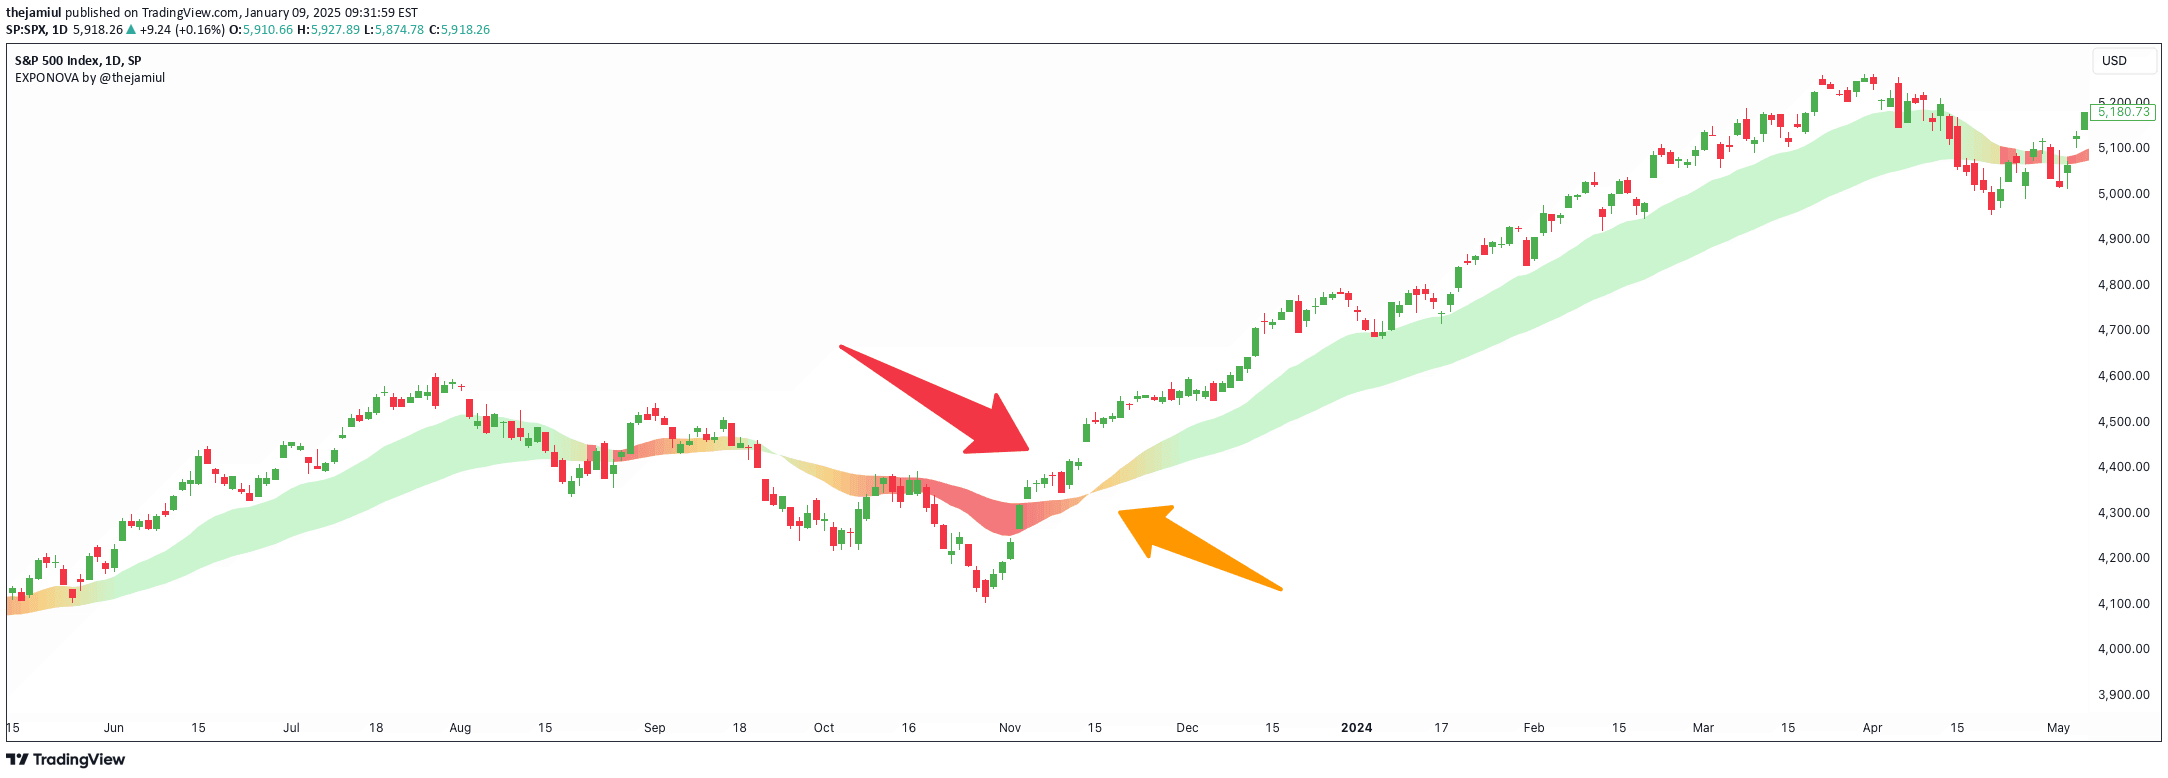
EXPONOVA is an advanced EMA-based indicator that uses dynamic gradient fills between two moving averages to visually represent market trends, momentum, and potential reversals.
A trading strategy analyzing 52-Week highs and lows to identify potential market reversals using EMA and divergence analysis across multiple sensitivity levels.
ZVOL transforms raw volume data into a statistically calibrated heatmap using Z-score thresholds, revealing meaningful crowd behavior across different market conditions.
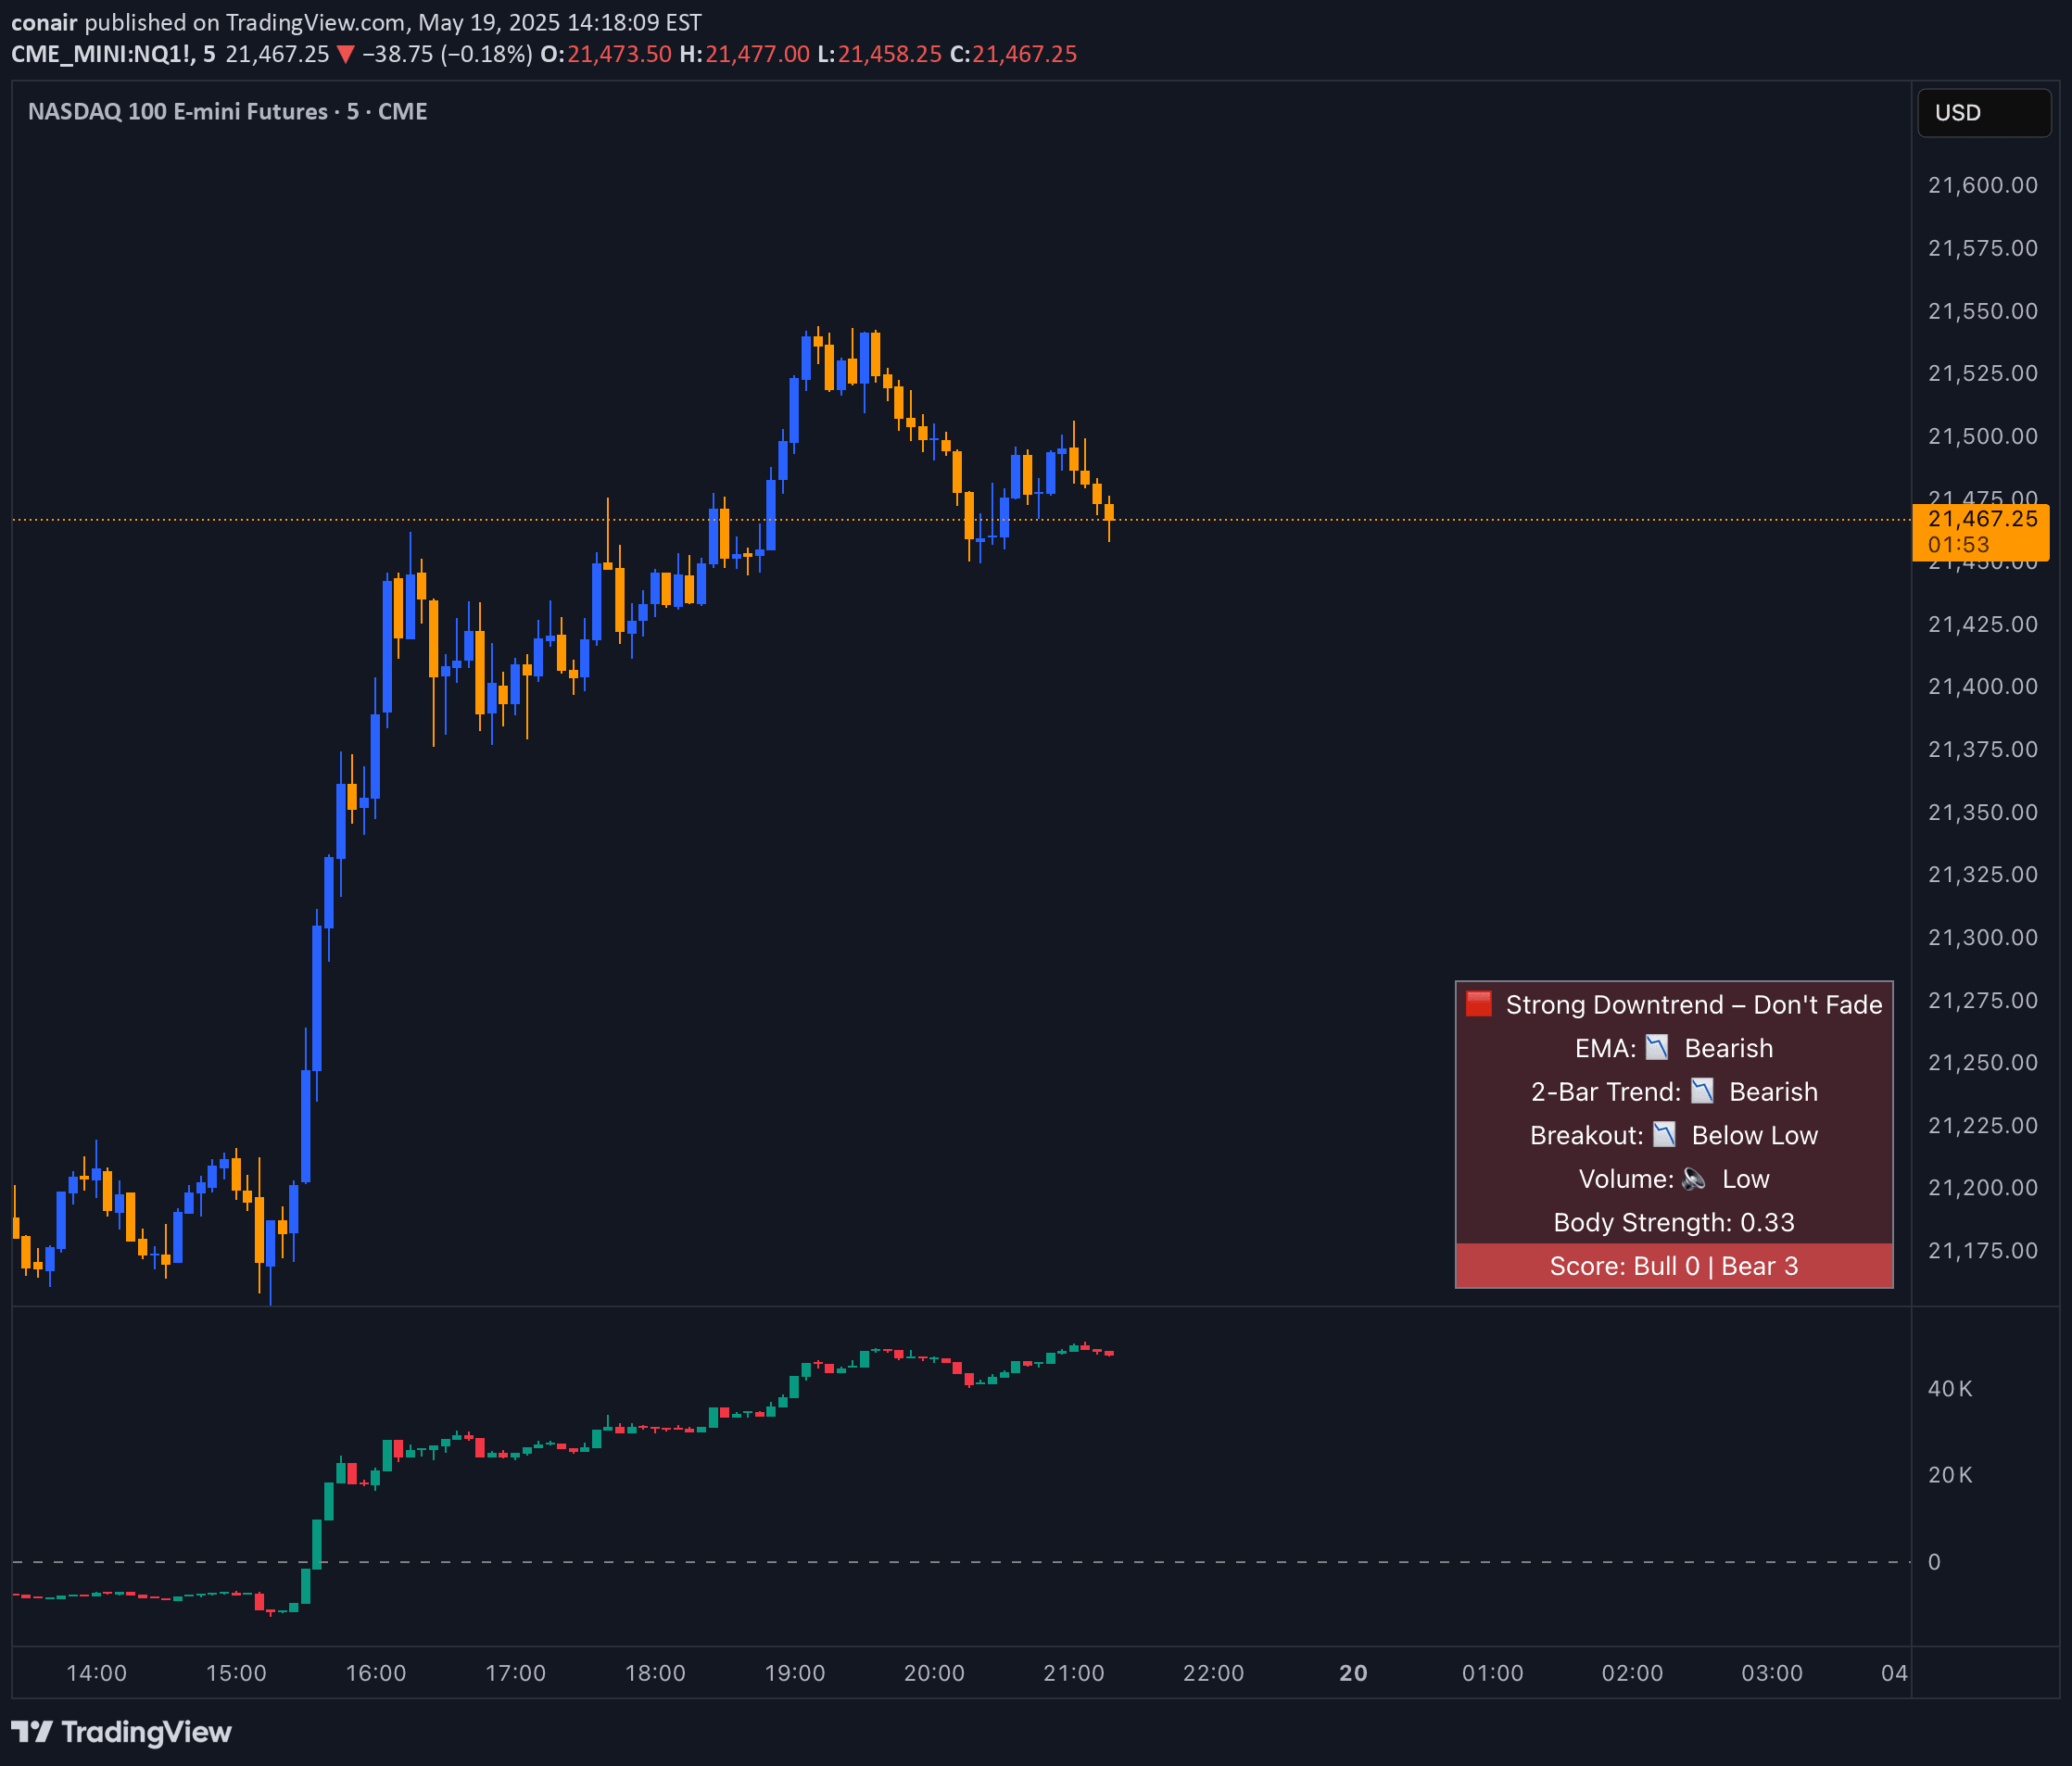
A multi-factor trend confirmation indicator that helps traders avoid fading strong market moves by analyzing price structure, momentum, volume, and trend bias in real-time.
Motion library provides dynamic text and visual transition effects for TradingView scripts, offering versatile animation techniques for displaying information and creating interactive visual elements.
Santa's Secrets is a festive trading indicator that overlays charts with holiday-themed characters, creating dynamic visual effects synchronized with market movements.
Likes, views, and comments are historical TradingView snapshots. They describe attention, not trading performance.