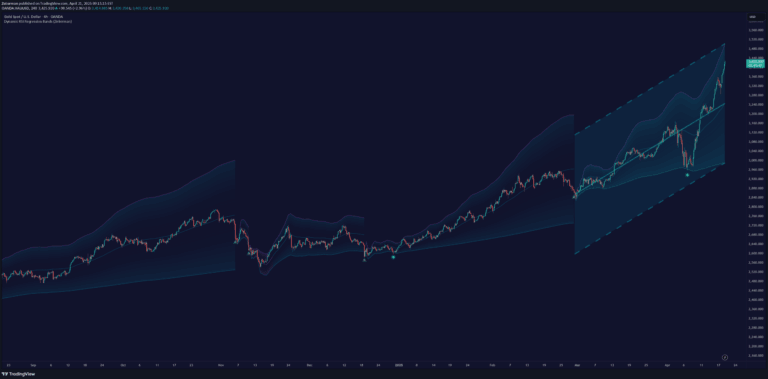
Channels With Patterns [ChartPrime]
An advanced trend channel indicator using pivot points and ATR to estimate trend direction quickly, with integrated candlestick pattern recognition for enhanced trading insights.
Explore 11,183 indicators. Filter beyond the obvious.
Discover the tools that fit the way you trade.
11,183 tools to explore
An advanced trend channel indicator using pivot points and ATR to estimate trend direction quickly, with integrated candlestick pattern recognition for enhanced trading insights.
A future-trend analysis tool that projects potential price direction by examining three consecutive periods, using price averages and volume delta to forecast market movement.
A dynamic RSI-based regression channel that adapts to market momentum by resetting its trend analysis when RSI crosses overbought or oversold levels, revealing potential trend shifts.
The Anchored Monte Carlo Shuffled Projection tool simulates potential future price points by randomly shuffling historical bar movements from a user-defined anchor point.
A comprehensive global liquidity indicator that tracks M2 money supply across 18 countries, helping traders analyze macro trends and potential Bitcoin price movements.
A custom trading indicator that tracks session-based OHLC statistics, analyzing price action within defined time ranges and calculating manipulation and distribution levels for strategic trading insights.
A predictive indicator that calculates the probability of moving average crossovers by analyzing potential future price movements and predicting MA interactions before they occur.
A normalized oscillator using forward-backward exponential moving averages to estimate directional shifts and market momentum with reduced lag and enhanced smoothing.
A trading indicator that identifies price imbalances like fair value gaps and large candle wicks across different timeframes, helping traders spot potential liquidity and rebalancing opportunities.
A forward-looking global liquidity index tracking money supply across five major economies, providing a 10-week projection of potential market conditions and monetary trends.
A candlestick-based trading indicator that identifies engulfing patterns to predict potential price reversals and trading zones using visual lines and areas on the chart.
A population sampled linear regression model that analyzes price momentum, distribution moments, and potential pivot points using statistical analysis and standard deviation tracking.
Likes, views, and comments are historical TradingView snapshots. They describe attention, not trading performance.