Global M2 YoY % Change (USD)
M2 Global Money Supply tracks year-over-year percentage changes in USD money supply across nations, providing insights into monetary expansion and potential economic trends.
Explore 11,183 indicators. Filter beyond the obvious.
Discover the tools that fit the way you trade.
11,183 tools to explore
M2 Global Money Supply tracks year-over-year percentage changes in USD money supply across nations, providing insights into monetary expansion and potential economic trends.
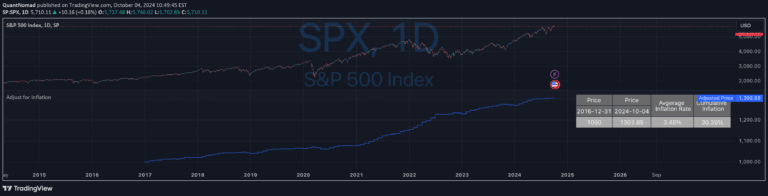
An inflation adjustment tool that recalculates historical prices using CPI data, helping traders understand the real value of price movements across different time periods.
An indicator designed to reveal the relationship between a product's price and market value, helping traders understand potential inflation and investment dynamics.
An inflation-adjusted performance indicator that multiplies an asset's price by a CPI-derived inflation factor to evaluate its value preservation over time.
A script that calculates the All-Time High (ATH) adjusted by global money supply index, providing a normalized perspective on price performance across different monetary environments.
A Pine Script indicator analyzing oil futures contract price ratios to determine market states of contango and backwardation, providing insights into supply-demand dynamics.
A TradingView script that adjusts Bitcoin's price for inflation, revealing its true purchasing power and value over time by comparing nominal and inflation-adjusted prices.
An inflation-adjusted price indicator that reveals the real value of an asset by comparing its current price to its historical purchasing power.
The Consumption Oscillator analyzes the relationship between Core Consumer Price Index and Personal Consumption Expenditure to assess economic inflationary or deflationary pressures.
The M2SL/DXY ratio analyzes the relationship between money supply and dollar strength, providing insights into potential cryptocurrency market movements and liquidity dynamics.
The CAPE Ratio is a long-term stock valuation metric that smooths earnings over 10 years using inflation-adjusted data to provide a comprehensive view of market valuation.
A method to calculate the inflation rate by comparing US 10-year Treasury yields with TIPS 10-year yields, providing insight into market-implied inflation expectations.
Likes, views, and comments are historical TradingView snapshots. They describe attention, not trading performance.