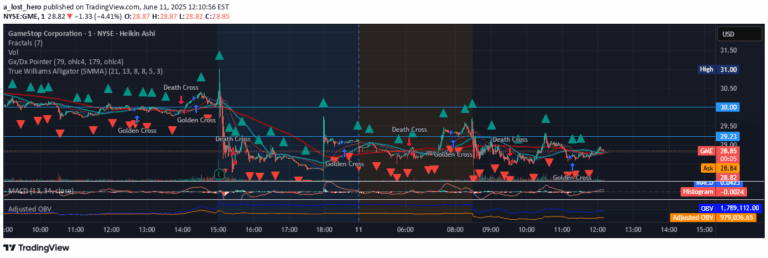
buyer_seller_scalping_indicator
A TradingView script analyzing trading volume within a specific time window, providing insights into market sentiment through volume distribution and buyer-seller dynamics.
Explore 11,183 indicators. Filter beyond the obvious.
Discover the tools that fit the way you trade.
11,183 tools to explore
A TradingView script analyzing trading volume within a specific time window, providing insights into market sentiment through volume distribution and buyer-seller dynamics.
RHODL Ratio analyzes realized value HODL waves by comparing 1-week and 1-2 year UTXO bands to identify potential market overheating or buying opportunities.
A Pine Script tool that analyzes gap trading behavior by tracking gap up and down days, measuring price movements and potential trading opportunities in equities and indices.
A custom indicator that highlights candles experiencing significant percentage price changes, allowing traders to identify potential breakout events and market shifts.
An advanced ATR-based volatility indicator that highlights market boundaries and trend reversals, helping traders identify potential breakout and entry points.
A position sizing calculator that helps traders determine optimal trade size based on portfolio risk, using fixed percentage or ATR-based stop-loss methods to manage capital effectively.
An advanced On-Balance Volume indicator that adjusts volume tracking by considering candle body size, wick lengths, and trading pressure to provide a more nuanced volume analysis.
A tool for identifying missing data points on charts by detecting time intervals between bars that exceed the current chart interval, visually marking gaps in data sequence.
Likes, views, and comments are historical TradingView snapshots. They describe attention, not trading performance.