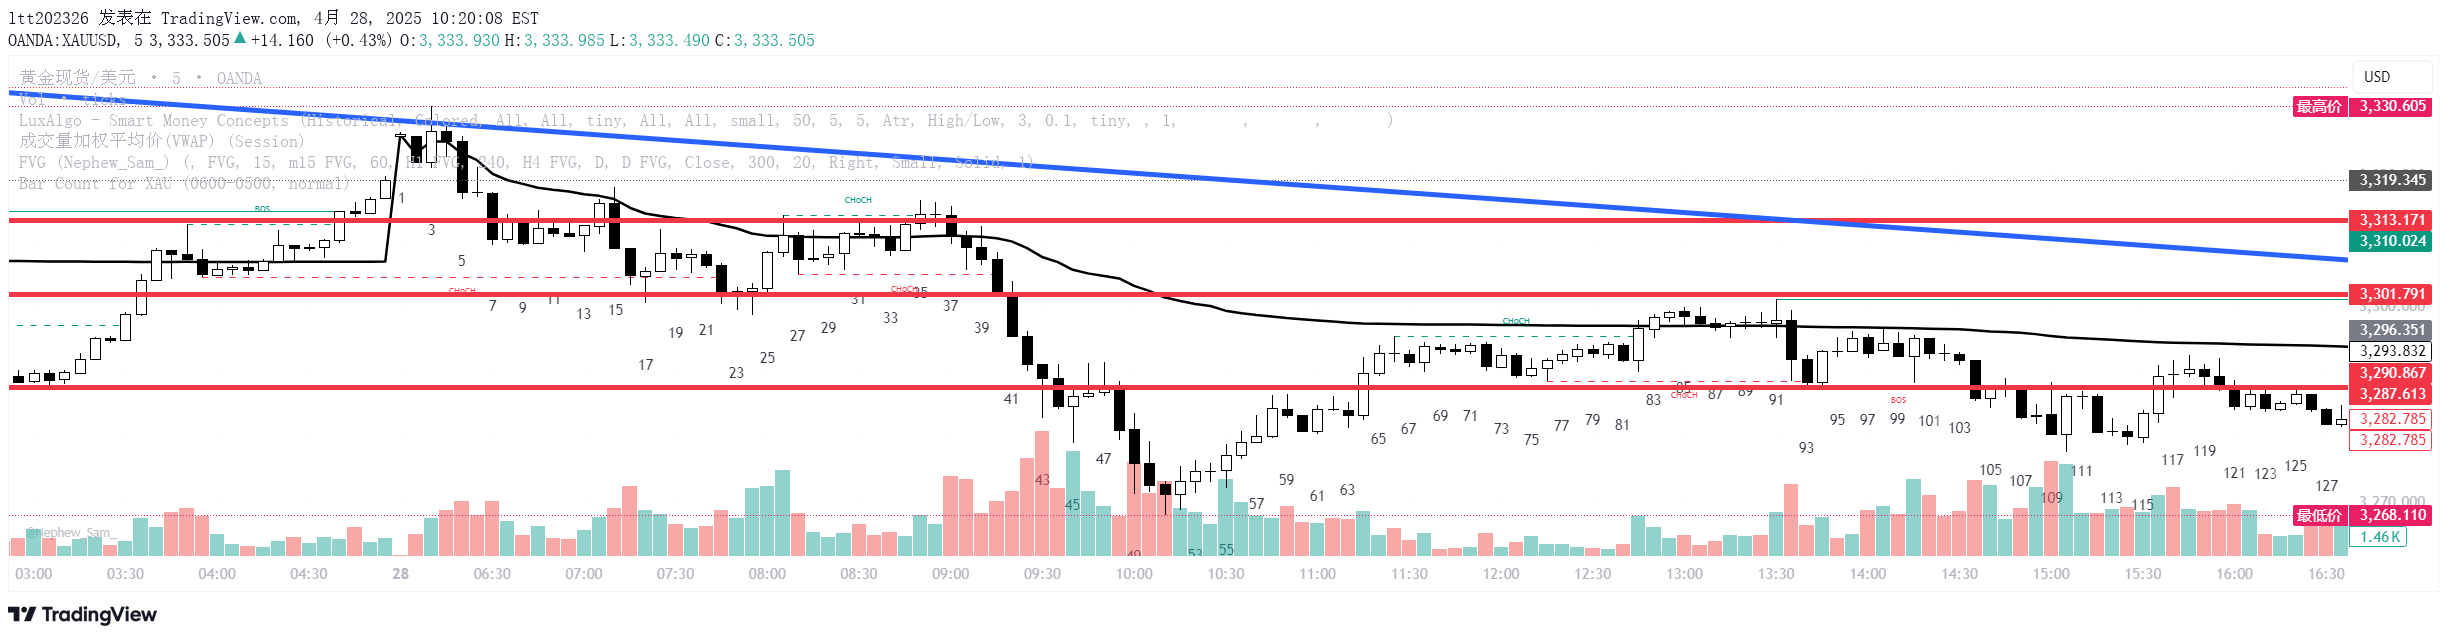
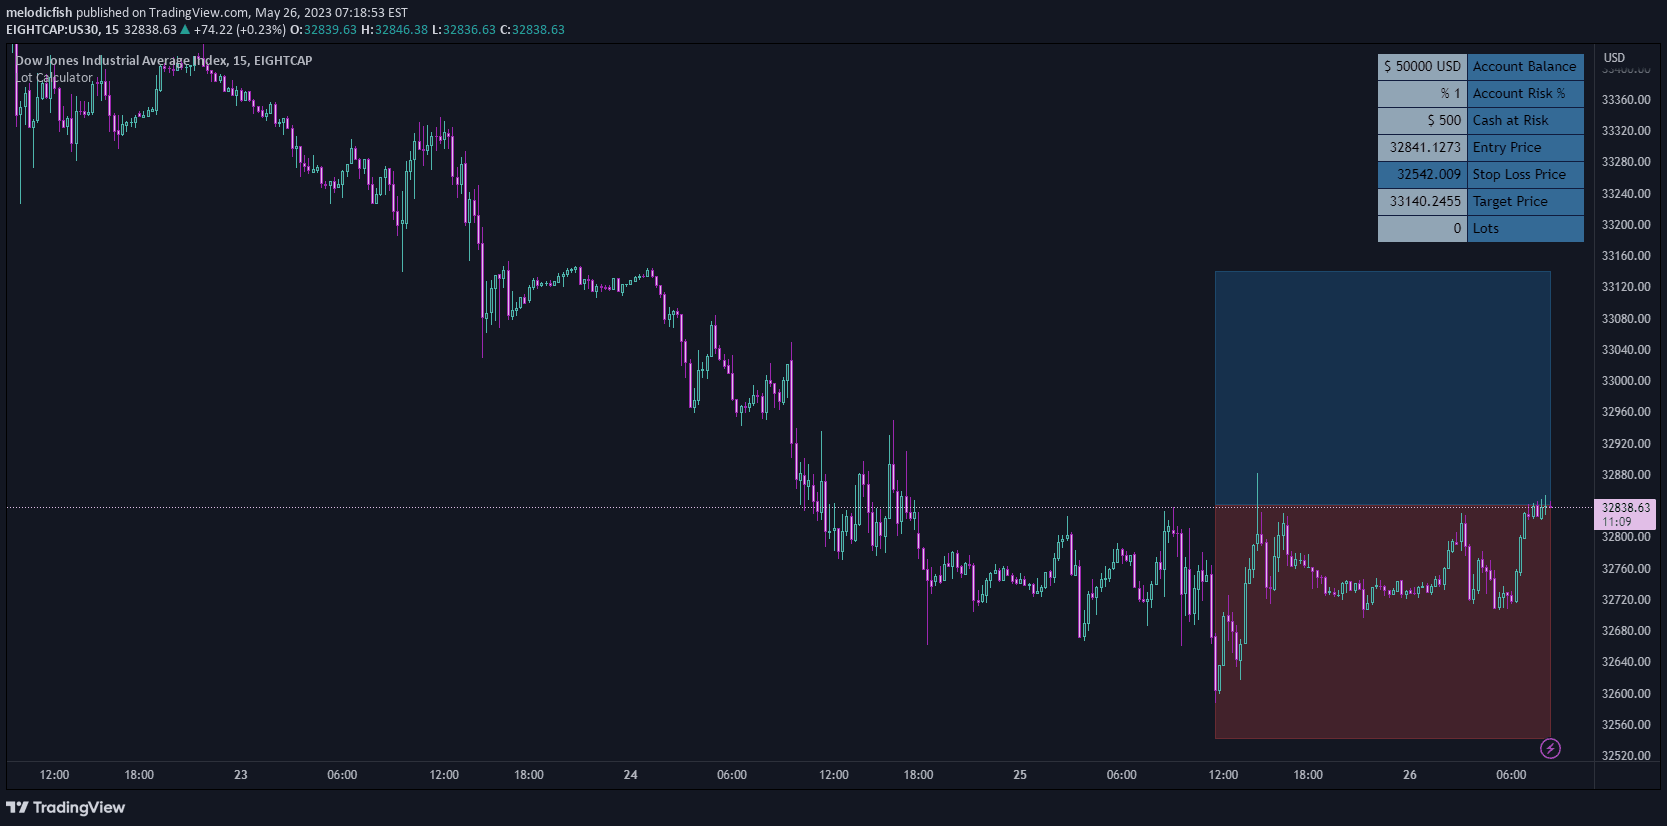
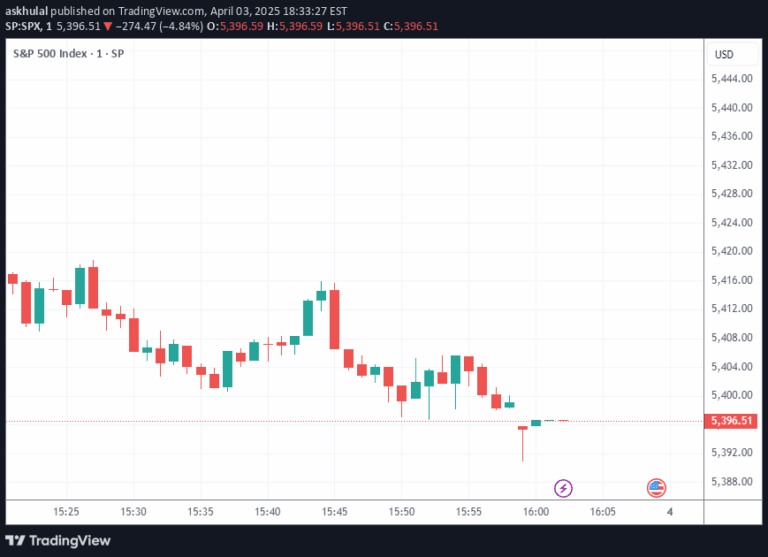
A tool for identifying missing data points on charts by detecting time intervals between bars that exceed the current chart interval, visually marking gaps in data sequence.
Explore complementary indicator rolesHow it works
The Lost Bar Locator systematically scans chart data to identify discontinuities in time series by comparing delta times between consecutive bars. When the time between bars exceeds the current chart interval, the indicator flags this as a potential data gap or missing information.
The tool then visually highlights these gaps by drawing two specific lines: one marking the bar immediately preceding the missing data points, and another marking the bar following the missing sequence. This visual representation helps traders quickly identify and understand potential data interruptions in their trading charts.
Why it may be useful
Detecting missing data points is crucial for maintaining data integrity and ensuring accurate technical analysis across various trading timeframes. Incomplete or interrupted data series can lead to incorrect interpretations of market movements, potentially causing misguided trading decisions.
By providing a clear visual mechanism to identify these gaps, traders can assess the reliability of their chart data, investigate potential technical issues with data feeds, and make more informed decisions about the completeness and accuracy of their market information.
When to explore it
The Lost Bar Locator is most effective when working with real-time market data feeds that might experience occasional transmission interruptions or when analyzing historical price data with potential recording gaps. It is particularly useful for traders who rely on precise, continuous data for their technical analysis and trading strategies.
Traders should employ this tool during market hours, when transitioning between different timeframes, or when investigating potential data synchronization issues across multiple trading platforms or data sources. It provides an immediate visual alert to potential data inconsistencies that might otherwise go unnoticed.
Keep exploring
What we’ve verified
Access, alerts and repainting behaviour have not been independently verified for this indicator. Check the creator’s current publication and settings.
General descriptions and classifications are recovered research. Verified details above identify the specific checks we have completed. Check the creator’s current publication for later changes.