Azlan MA Silang PLUS++
An advanced moving average crossover indicator that provides initial and re-entry trading signals using dual moving averages with customizable parameters and smart re-entry options.
Explore 11,183 indicators. Filter beyond the obvious.
Discover the tools that fit the way you trade.
11,183 tools to explore
An advanced moving average crossover indicator that provides initial and re-entry trading signals using dual moving averages with customizable parameters and smart re-entry options.
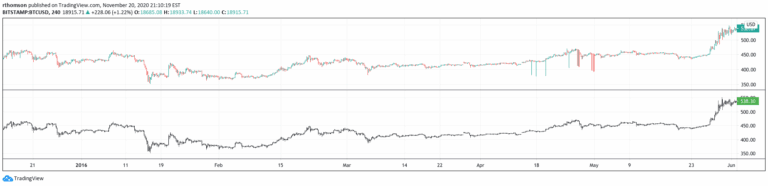
A trading signal that creates price candles using a median aggregated Bitcoin index from multiple exchanges, aiming to minimize data inconsistencies and provide more reliable price history.
EPS Line Indicator tracks a company's earnings per share directly on a chart, visualizing profitability trends and helping investors assess financial performance over time.
Advanced earnings analysis framework tracking S&P 500 top 25 stocks' earnings surprises, calculating actual and estimated EPS to identify potential market-moving events.
A VWAP indicator that automatically adapts to missing volume data by using a fallback TWAP calculation, providing consistent daily, weekly, and monthly price level insights.
Highlights potential data synchronization issues between trading symbols on higher timeframes, revealing discrepancies in market data that could impact trading decisions.
A trading tool that fills data gaps in market charts, ensuring seamless visualization of price action across different timeframes and market conditions.
A tool for identifying missing data points on charts by detecting time intervals between bars that exceed the current chart interval, visually marking gaps in data sequence.
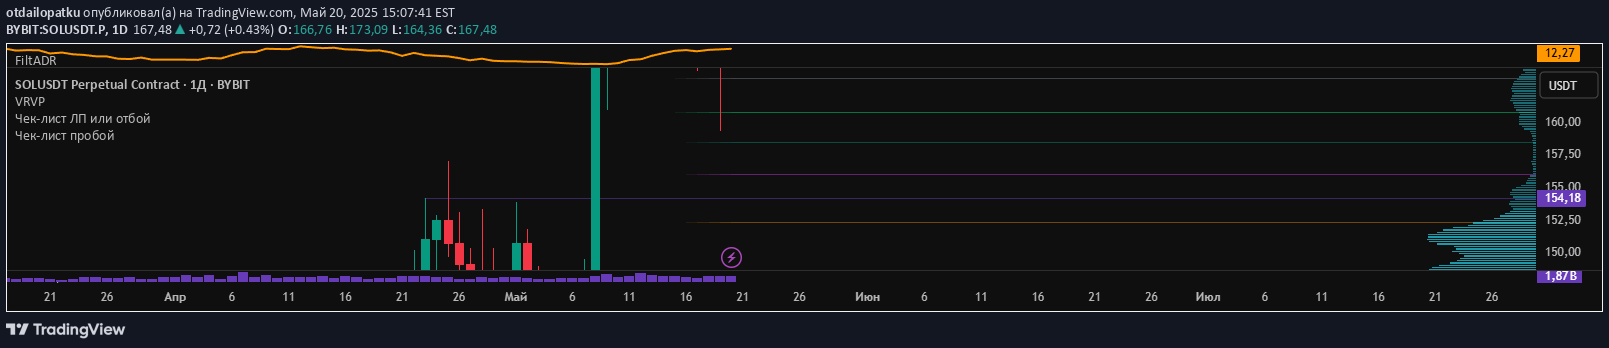
A refined Average Daily Range indicator that filters out extreme price ranges to provide a more stable volatility measurement across 14 daily candles.
A sophisticated Pine Script tool designed to detect and analyze gaps in cryptocurrency price data, highlighting potential data integrity issues that could impact trading strategies.
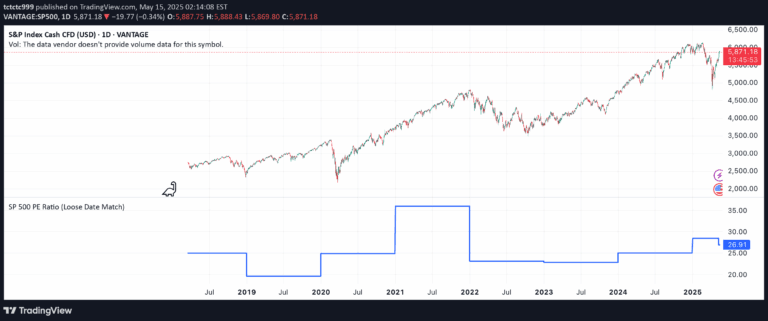
A custom indicator that visualizes the historical S&P 500 Price-to-Earnings (PE) Ratio from Excel data, providing insights into market valuation trends and potential entry/exit zones.
Likes, views, and comments are historical TradingView snapshots. They describe attention, not trading performance.